
10,1 million SA learners walk all the way to their educational institution
The National Household Travel Survey (NHTS), 2020 results shows that ‘walking all the way’ remained the mode of travel that was most used by learners to reach their educational institution in all nine provinces. The survey, released by Statistics South Africa in collaboration with the Department of Transport, reports that about 10,1 million learners walked all the way to their educational institution. The number of learners who walked all the way represents 59,4% of all learners. This is a decrease from the 11 million observed in 2013 which represented 63,4% of all learners.
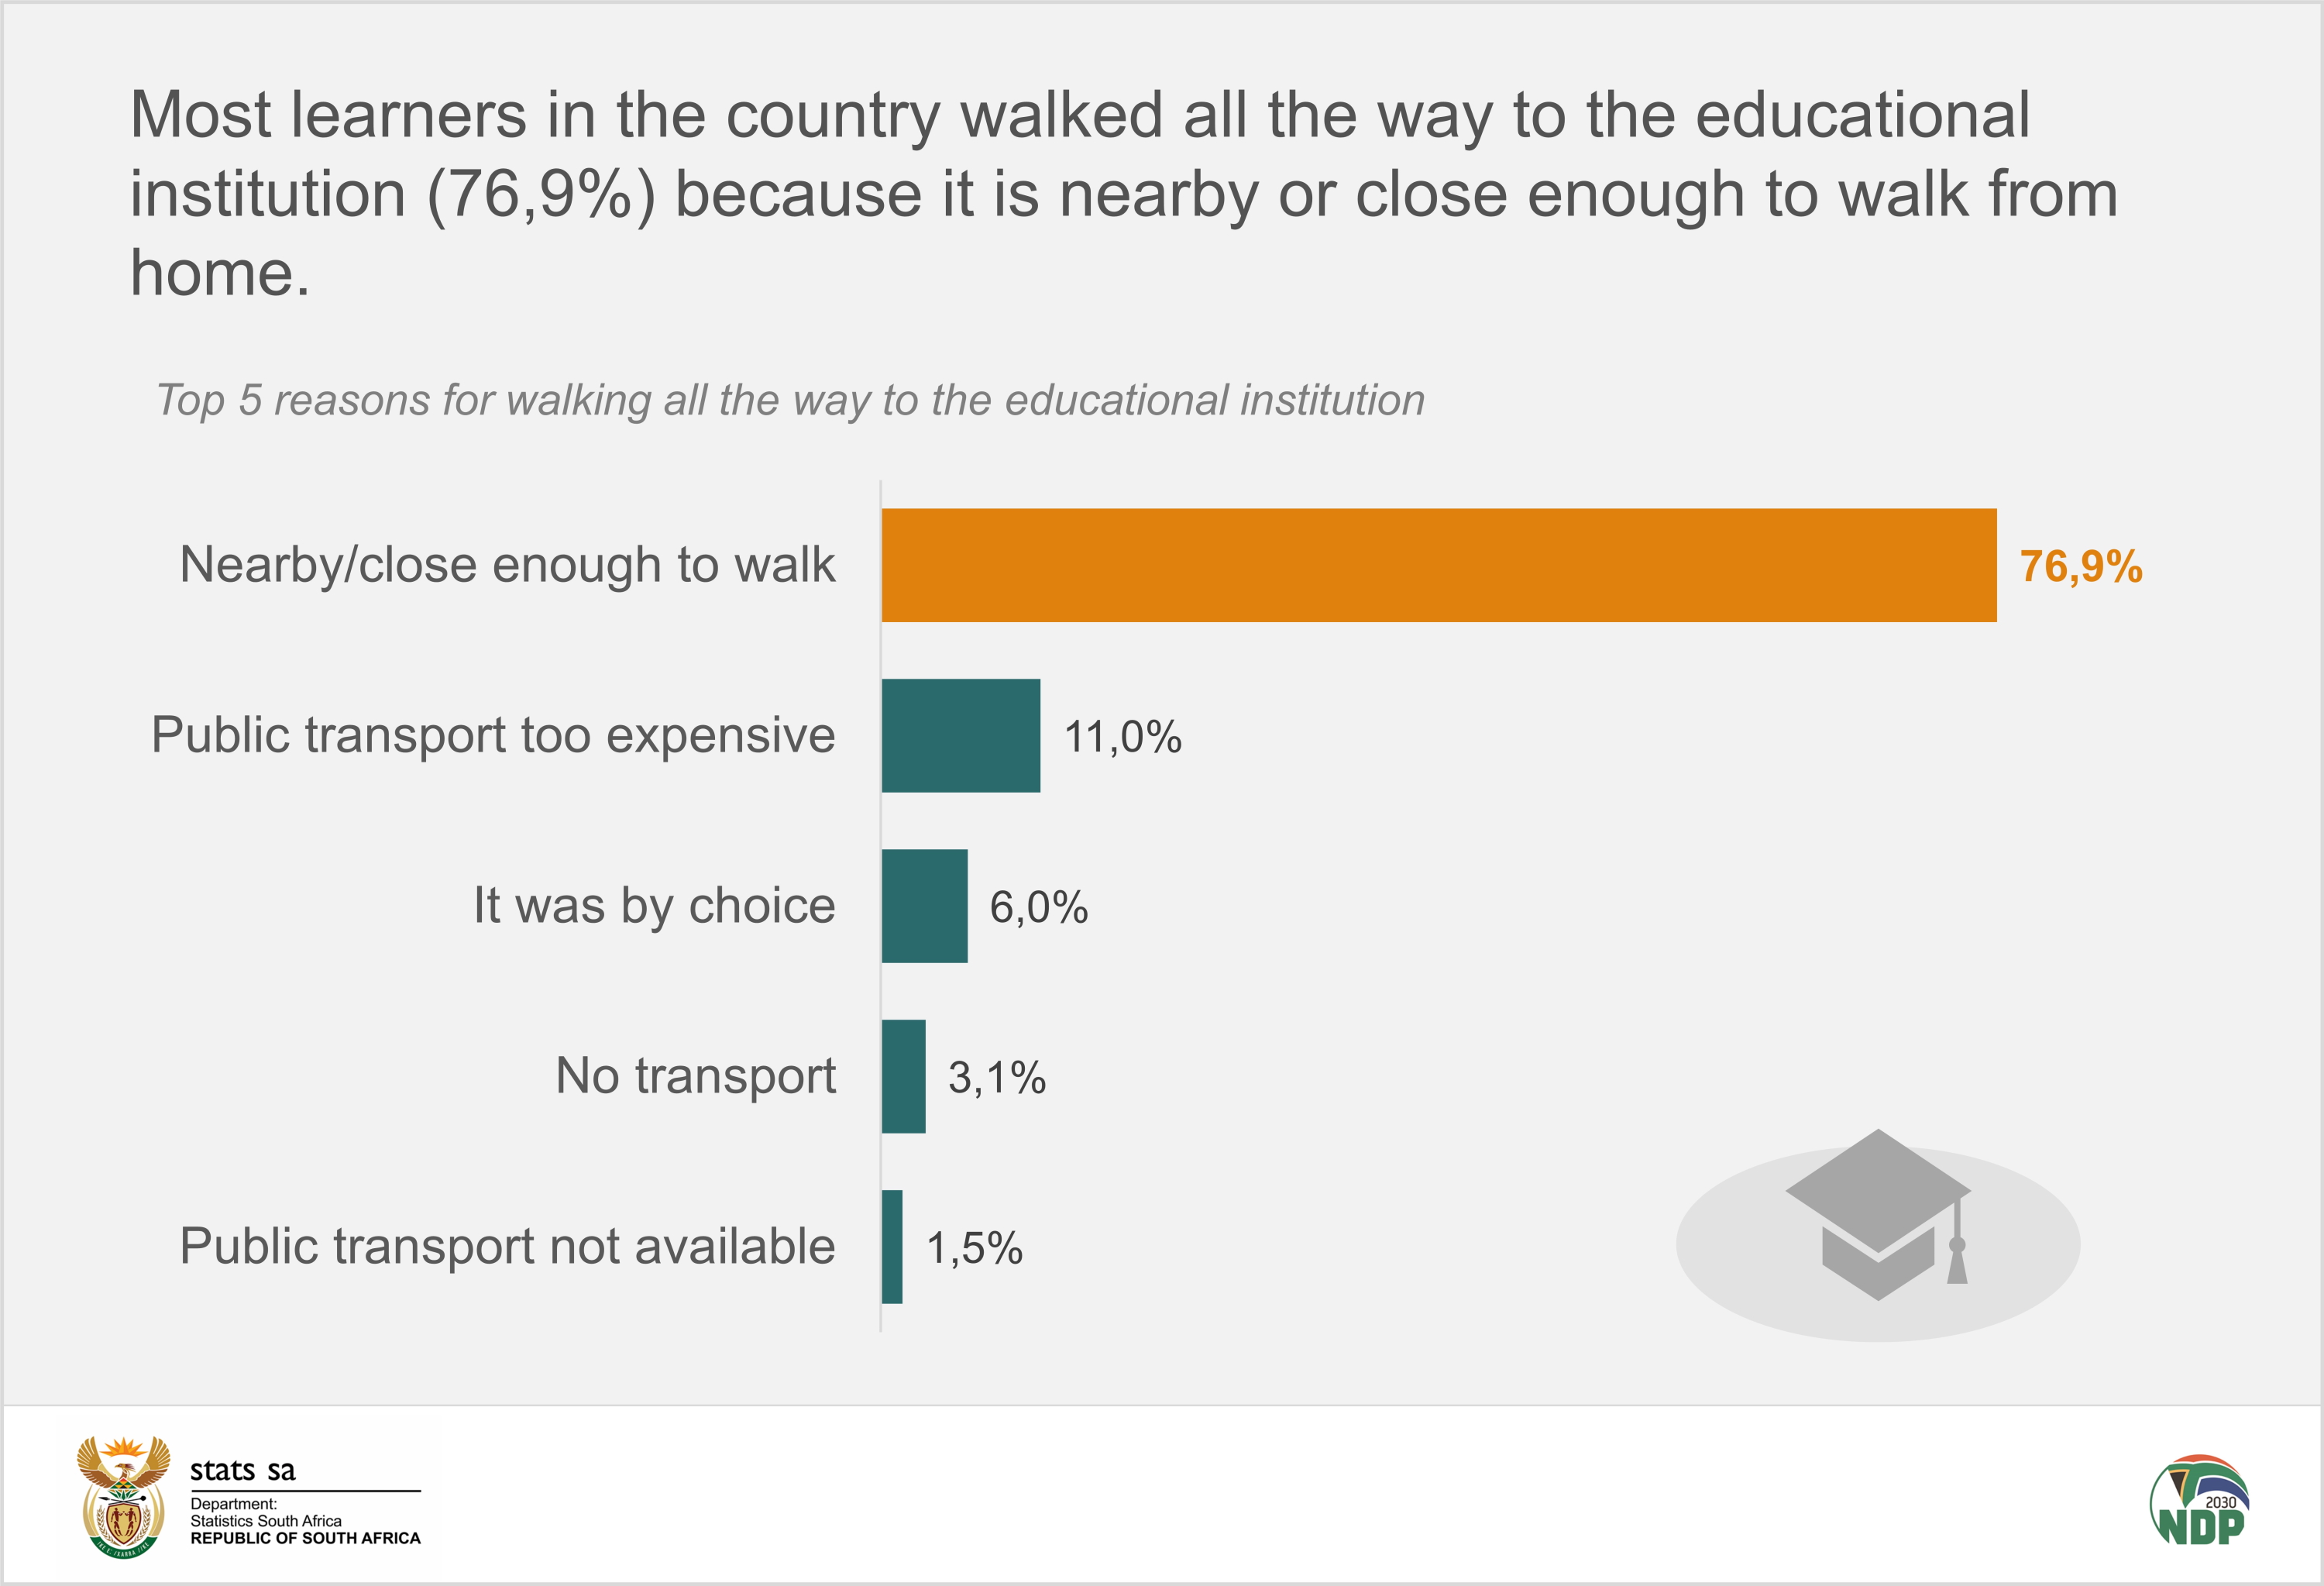
All South Africans have a Constitutional right to have access to basic education and further education. The time from home to school or educational institution is an important factor to consider when determining the ease or difficulty one would experience when travelling to these institutions. Most learners in the country walked all the way to the educational institution (76,9%) because it is nearby or close enough to walk from home. The second reason provided was that public transport was too expensive (11,0%). This reason was most likely to be given in rural areas (13,1%).
Walking all the way to the educational institution was prevalent amongst learners who attended school. Learners who attended a higher educational institution were most likely to use a taxi (31,5%), and driving a car/truck (24,1%) to reach their destination.
Across the provinces, the highest percentage of learners who walked to their educational institution were in KwaZulu-Natal (20,3%) and Gauteng (17,7%), followed by 14,6% in the Eastern Cape and Limpopo.
Learners who attended an educational institution and who used public transport were most likely to use a taxi (72,4%) as their mode of transport. Almost 27% used a bus (26,6%), while 1,0% used a train. Leaners who attended an educational institution and used a taxi were most likely to live in urban areas, compared to learners living in rural areas, who were most likely to use a bus.
Most workers used private transport (43,5%) as their main mode of travel to work, while 35,0% used public transport. 20,3% of workers reported walking all the way.
For work-related travel, the use of public transport was important across all geographic locations. However, urban workers were more likely to use a taxi than a bus as their main mode of transport, while rural workers were most likely to use a bus as their main mode of transport.
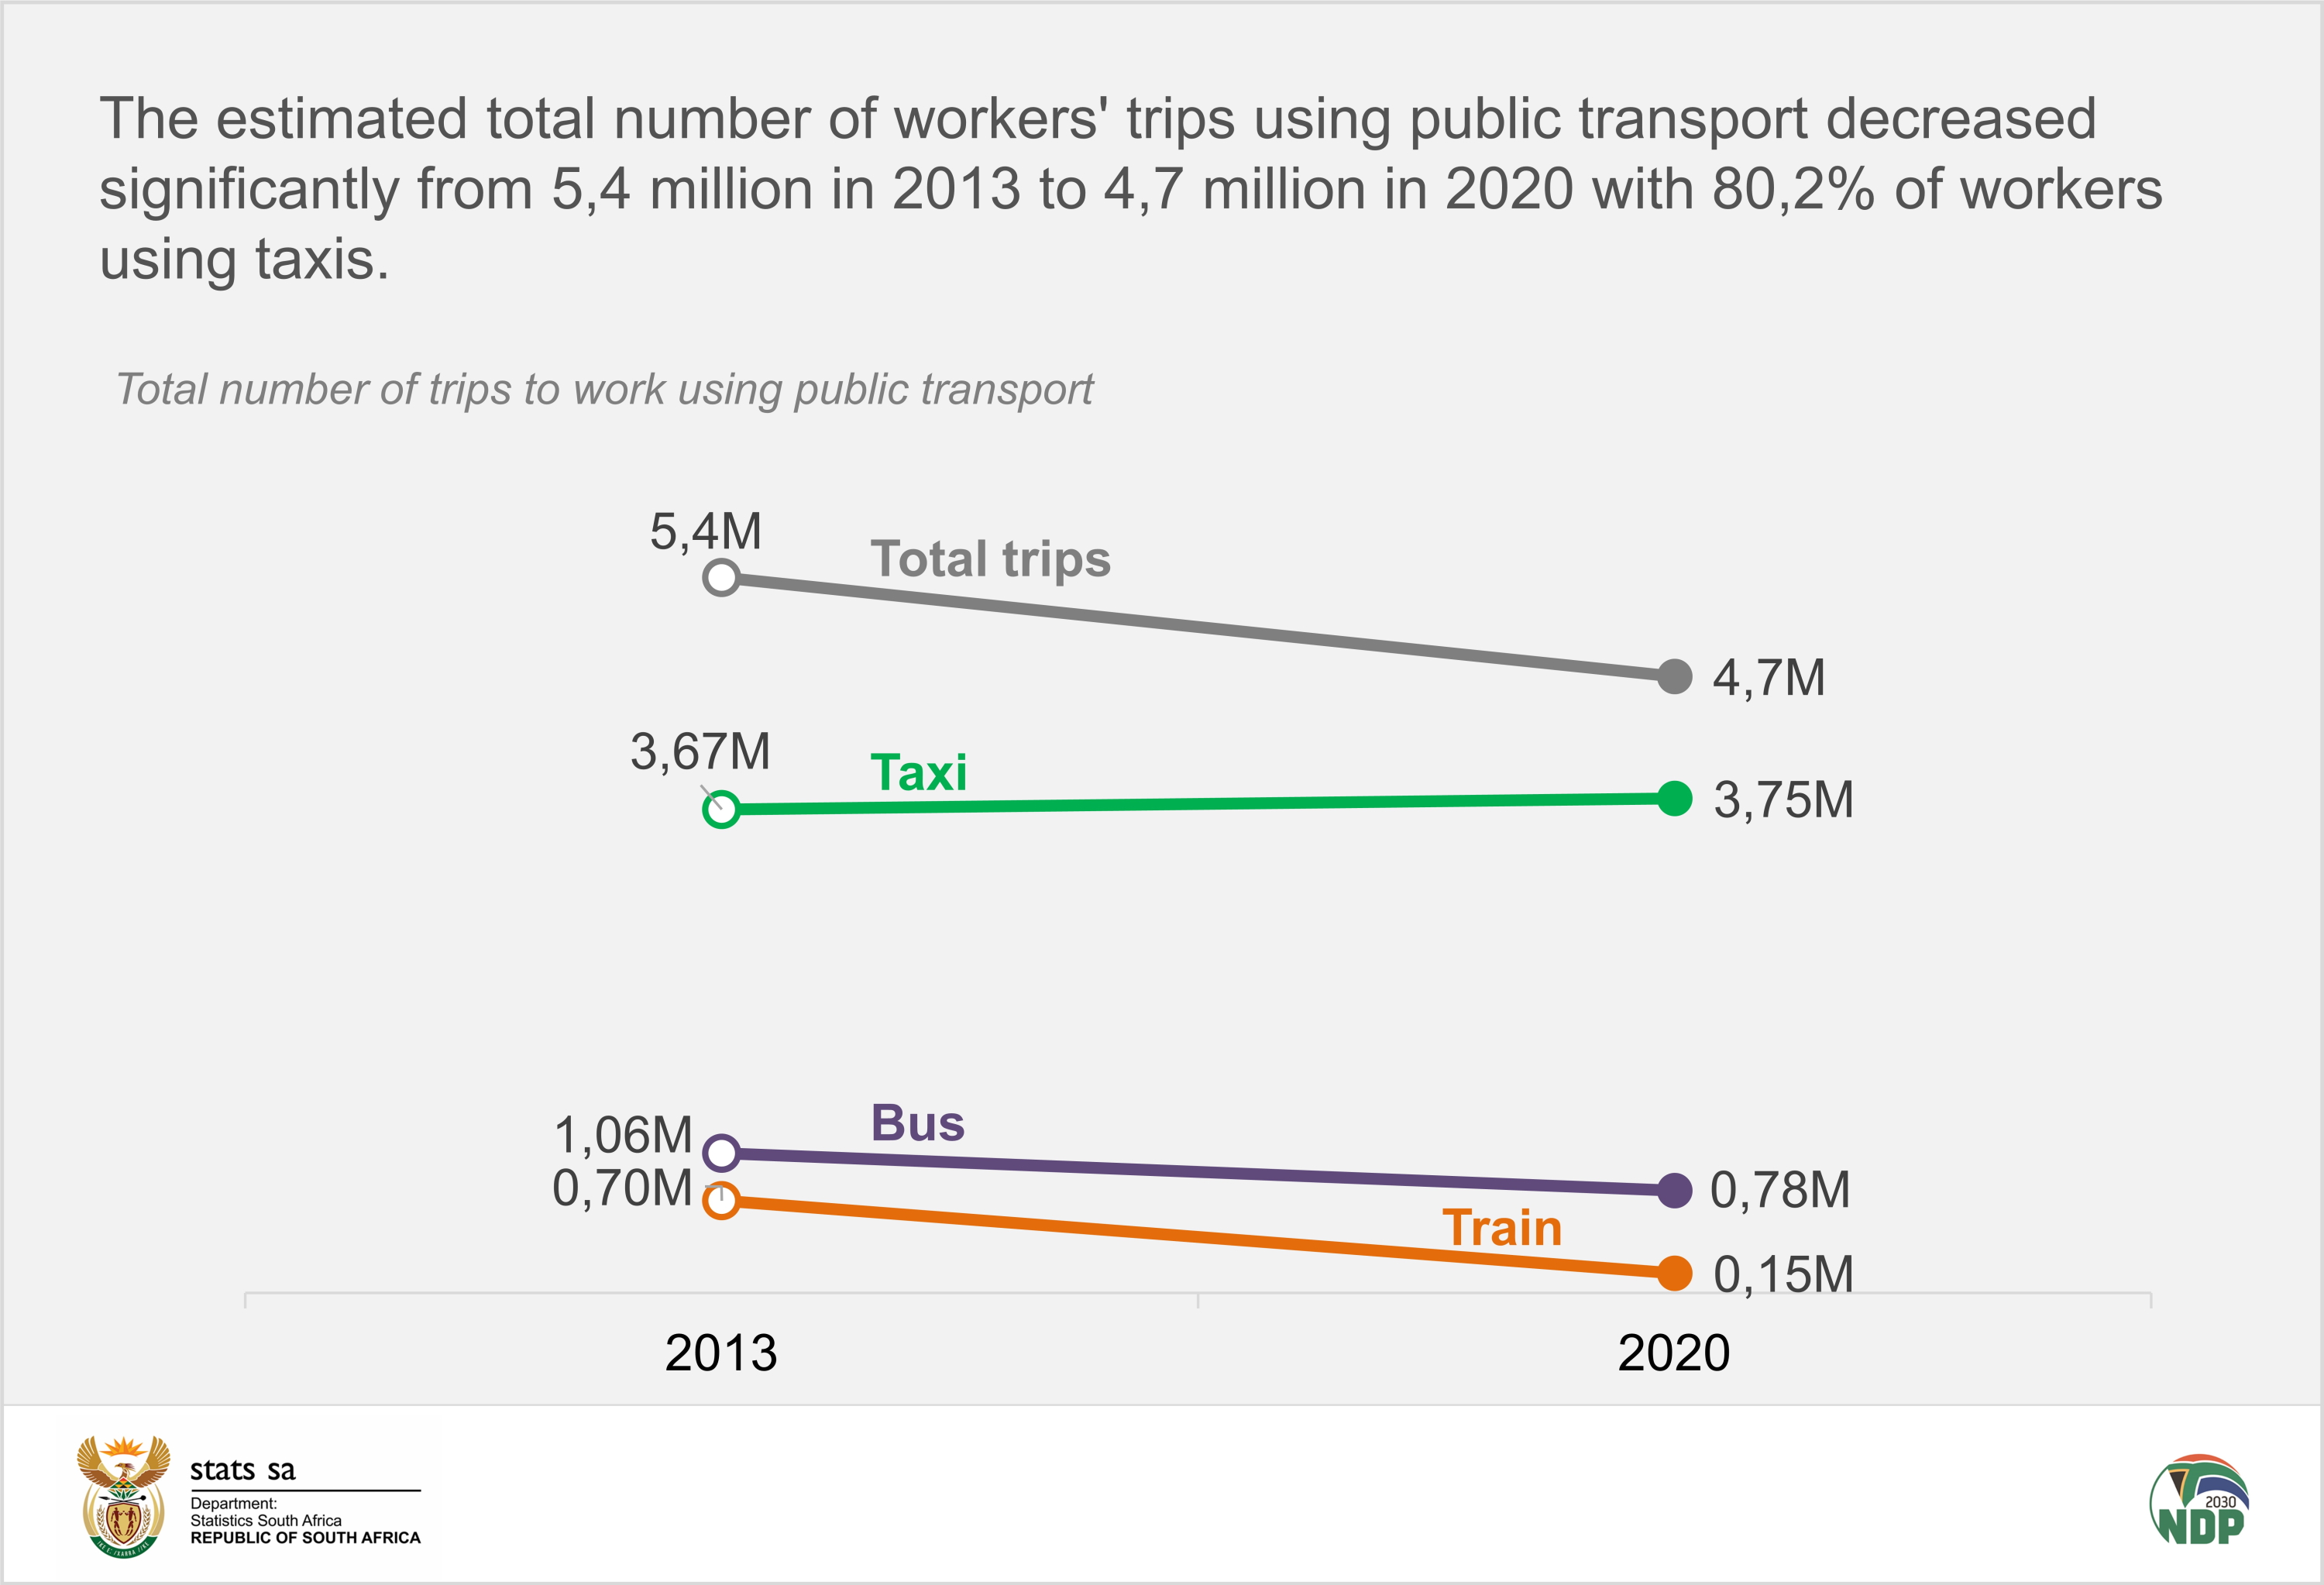
The estimated total number of workers’ trips using public transport decreased significantly from 5,4 million in 2013 to 4,7 million in 2020. Taxis accounted for most public transport users, with 80,2% of workers using taxis, which is more than the proportion reported in 2013 (67,6%). More than fifteen per cent (16,6%) of workers using public transport used buses in 2020, whereas in 2013, the percentage of workers who used buses was 19,5%. Those who used trains in 2013 (12,9%) significantly decreased to 3,2% in 2020.
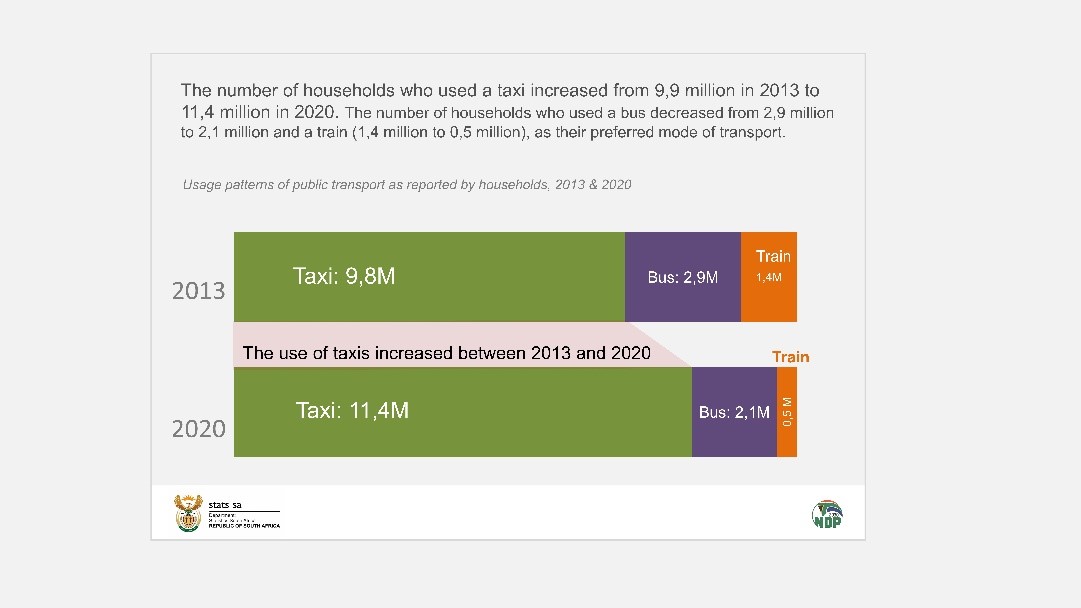
The general usage patterns of public transport as reported by households has changed significantly between 2013 and 2020. There has been an increase in households who used a taxi (from 9,8 million to 11,4 million). However, a decrease was recorded in the number of households who used a bus (from 2,9 million to 2,1 million) and a train (1,4 million to 0,5 million) as their preferred mode of transport.
Facilities at the taxi rank and taxi fare remained the highest reason for dissatisfaction with minibus taxi services among South African households. In 2020, more than half of these households (56,9%) were dissatisfied with the facilities at the taxi rank. Regarding bus services, households were most dissatisfied with bus stop facilities, the level of crowding in the bus and security at the bus stop.
In 2013, reasons most likely to be indicated for dissatisfaction with train services were the level of crowding in the train (78,2%), followed by security on the walk to/from the train station (56,6%). In 2020, the level of crowding in the trains (86,8%) and waiting time for trains (86,6%) were the biggest problems mentioned by households.
The NHTS report covers a wide variety of travel data on household and individual travel patterns in South Africa. For more information, download the full report here.