

IMPROVING LIVES THROUGH DATA ECOSYSTEMS
Mapping vulnerability to COVID-19
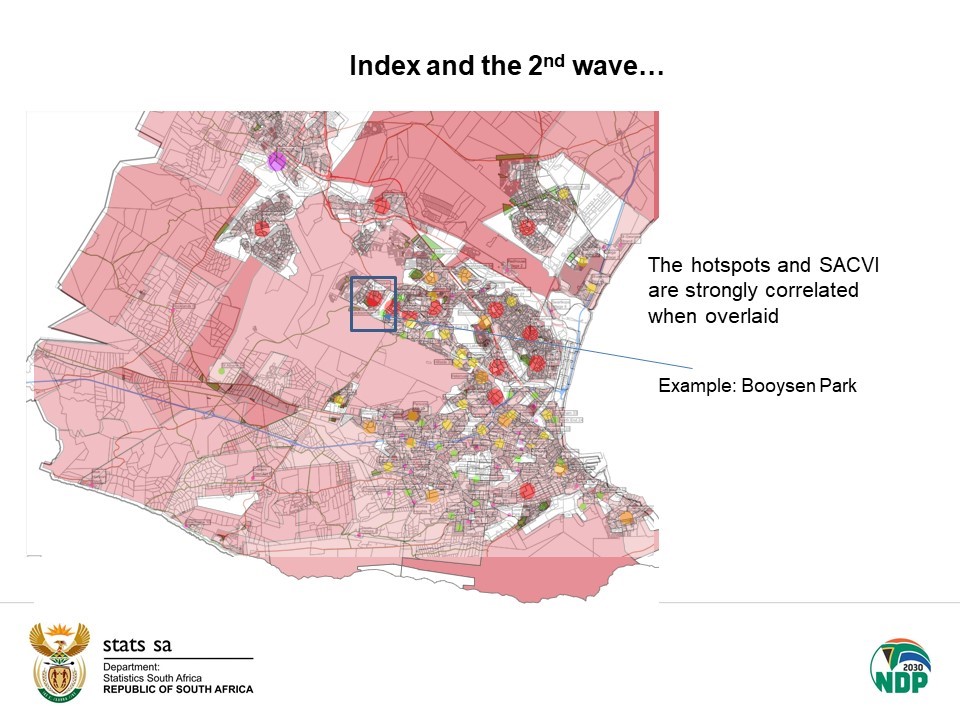
With South Africa officially facing its second wave of COVID-19 infections, Statistics South Africa (Stats SA) has released an innovative online mapping tool that shows which communities may be more adversely affected by COVID-19 outbreaks. The South African Covid-19 Vulnerability Index (VIndex) was developed as a way of using the smallest area population data available and incorporating dimensions and indicators to statistically reflect localised risk factors that may contribute to the spread of COVID-19 for each individual against a set criteria being measured.
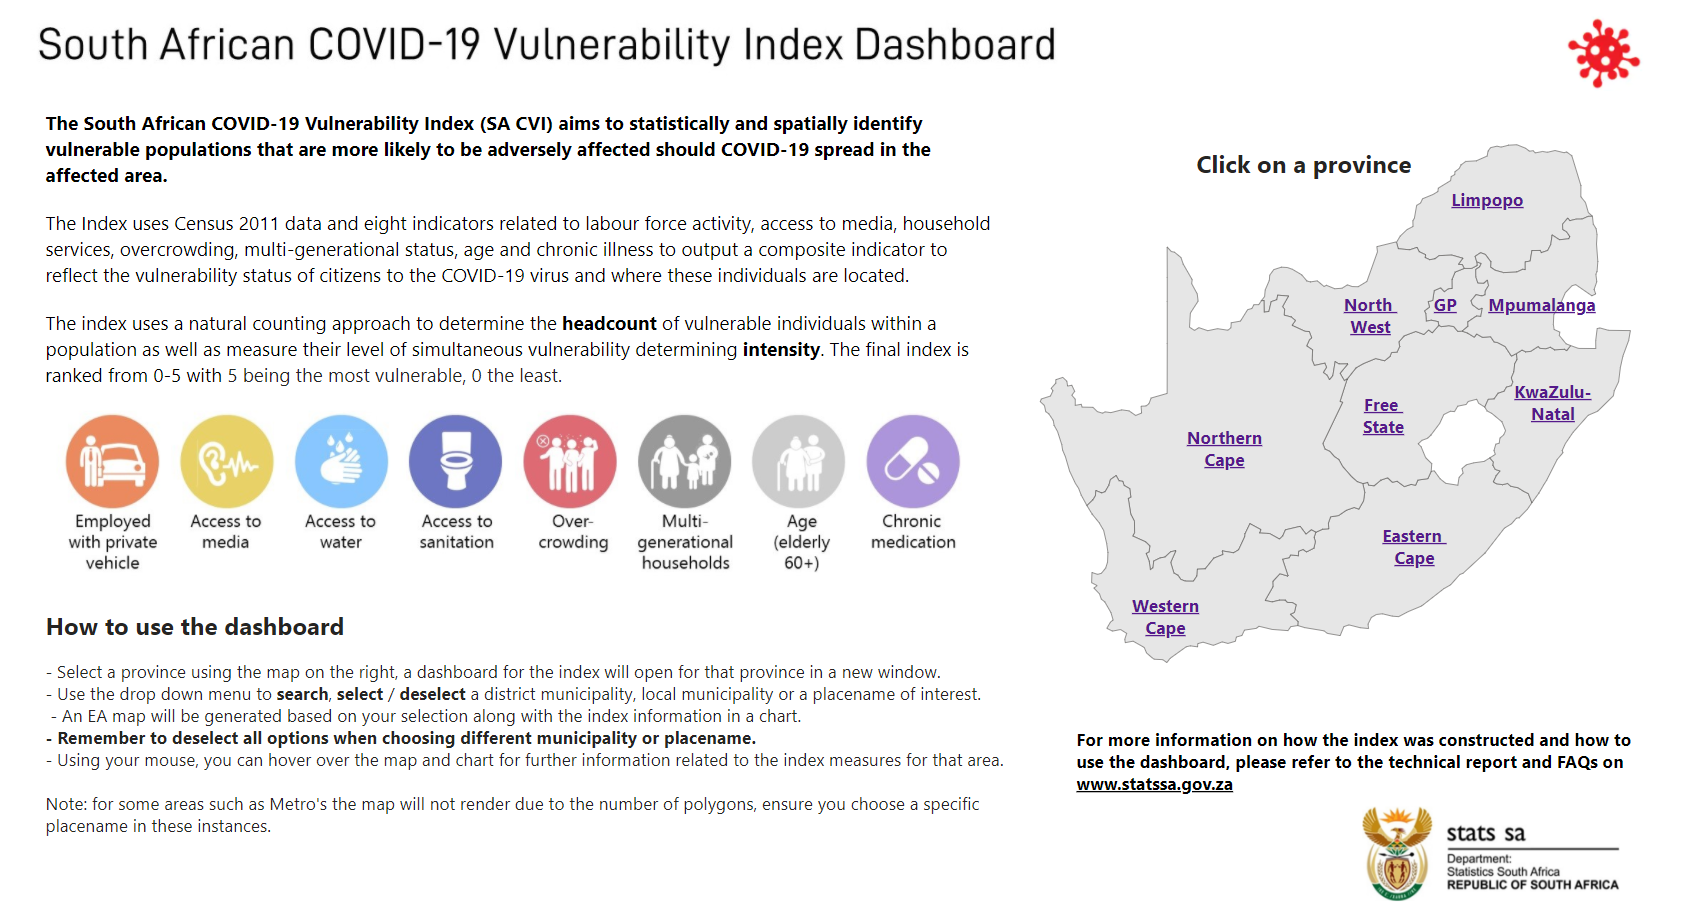
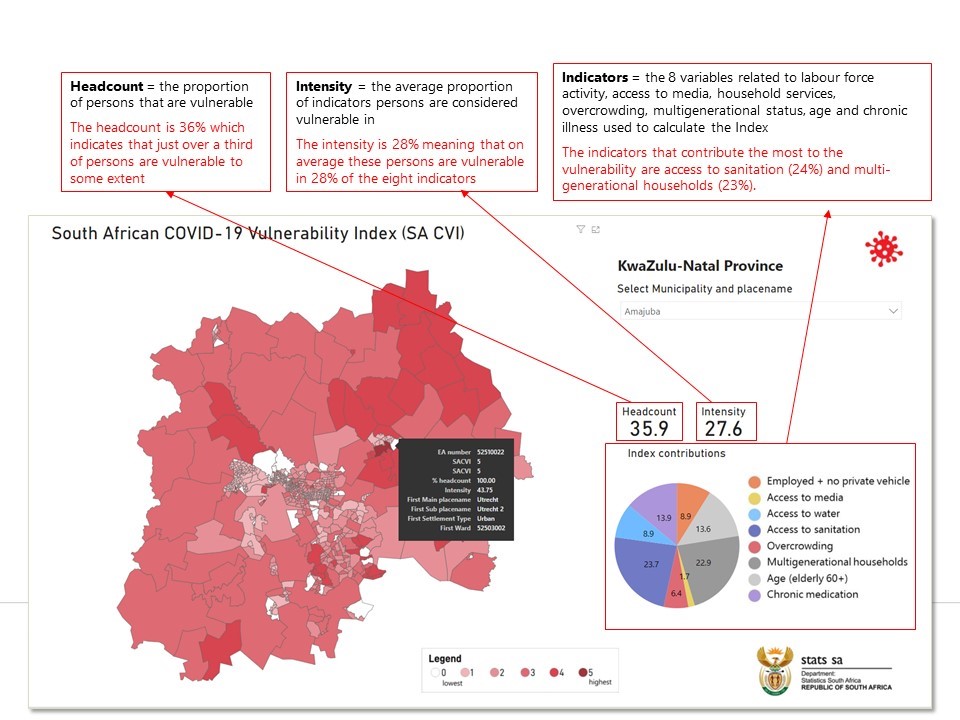
The Vindex uses Census 2011 data and eight indicators related to labour force activity, access to media, household services, overcrowding, multigenerational status, age and chronic illness to output a composite indicator to reflect the vulnerability status of citizens to the Covid-19 virus and where these individuals are located.
The index uses a natural counting approach to determine the headcount of vulnerable individuals within a population as well as measure their level of simultaneous vulnerability determining intensity. ‘Vulnerability’ in this context refers to the demographic and socioeconomic factors that affect the resilience of individuals and communities, and represent those more likely to be adversely affected when COVID-19 manifests itself. COVID-19 disproportionately affects the elderly and those with underlying health conditions, and the population at risk includes those exposed to increased health and social vulnerability. For example those who:
- are poor or live in deprived conditions which impacts on health and sanitation;
- live in crowded areas or informal settlements which impacts on social distancing; and
- live in multi-generational households and large extended families in a single dwelling.
The index aims to identify these populations that are at multiple risk to identify areas where the population are considered most vulnerable to COVID-19. The Vulnerability Index score was then calculated as the headcount multiplied by the intensity. The final score was ranked from 0-5, with 5 being the most vulnerable, 0 the least.
The use of Census 2011 data allows for the index to be mapped to the smallest possible area, i.e. an enumeration area (EA), which is the smallest geographical area into which the country is divided for Census purposes and contains between 100 to 250 households. Nine provincial dashboards were developed, and the index can be queried at placename and municipality level.
The VIndex can serve as a tool to assist with targeted response planning as it highlights areas which are vulnerable to COVID as defined by the rank and indicators that are most prevalent. The VIndex can also serve as means for evidence-based pandemic management planning to provide the best and most feasible location-focused response.
The Vindex dashboard can be accessed here
The Vindex technical report can be accessed here
The VIndex FAQs can be accessed here
Stats SA has also released a report outlining the possible effect the pandemic might have on certain demographics, namely mortality, fertility and migration. The demographic impact report can be found here.