
GDP rallies as lockdown restrictions ease
South Africa’s economy rebounded in the third quarter of 2020 (July–September), coinciding with the easing of COVID-19 lockdown restrictions. All industries recorded an increase in economic activity compared with the second quarter, with manufacturing, trade and mining leading the charge. Businesses were supported by an increase in both exports and household spending.
Gross domestic product (GDP) grew by an estimated 13,5% in the third quarter, giving an annualised growth rate of 66,1%.1 This follows the significant slump of 16,6% (annualised: -51,7%) in the second quarter during the most restrictive months of the lockdown (April, May and June).
Interpreting the rebound
The surge in economic activity in the third quarter may seem impressive, but it comes off the very low base recorded in the second quarter. South African industries still have a long way to go before reaching levels of production seen before the pandemic. Despite the rebound, the economy is still 5,8% smaller than it was at the end of 2019.2
Manufacturing, trade and mining were the biggest drivers of growth in the third quarter. The manufacturing industry rose at an annualised rate of 210,2%, mostly driven by increases in the production of basic metal products, petroleum, vehicles, and food and beverages (click on the chart to enlarge).
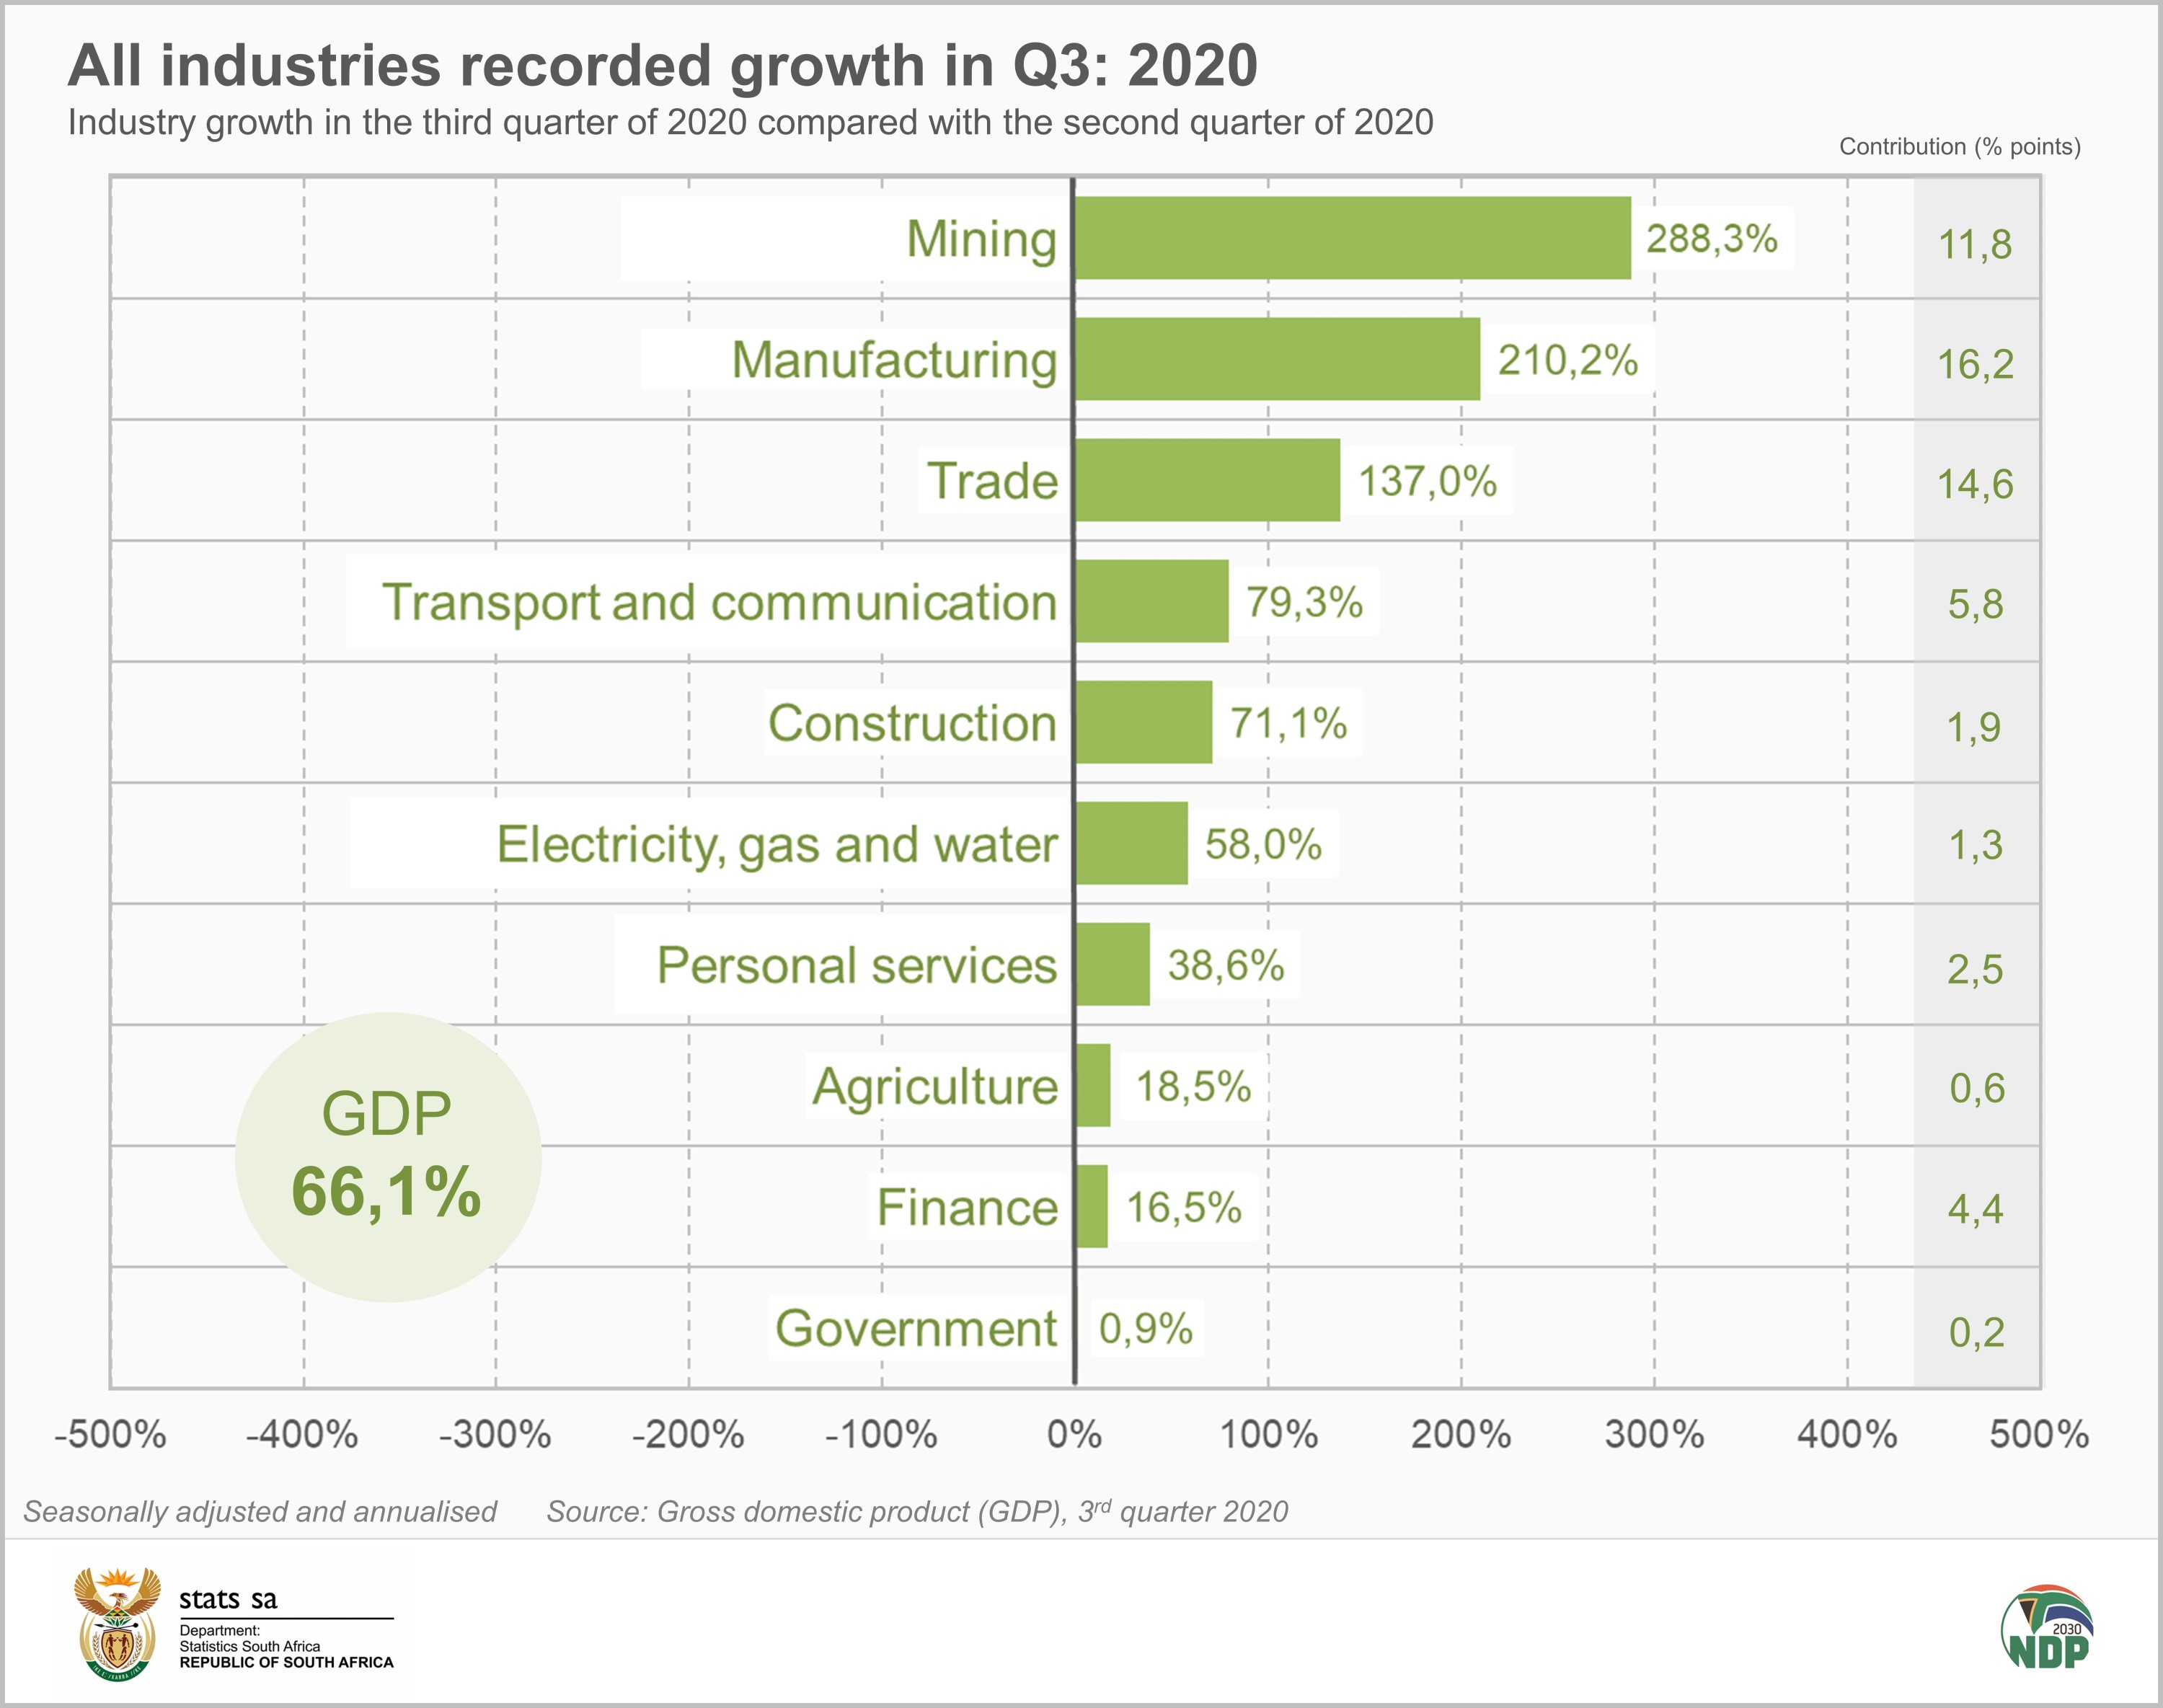
Trade was the second biggest positive contributor to growth, increasing at an annualised rate of 137,0%. There was a rise in wholesale, retail and motor trade sales, supported by increased consumer spending.
The jump in mining activity was driven mostly by increased production of platinum group metals, iron ore, gold and manganese ore. The industry was also supported by a rise in exports.
Despite all industries recording positive results in the third quarter, agriculture and government are the only two that have so far weathered the effects of the pandemic. Comparing the level of economic activity in the first three quarters of 2020 with the first three quarters of 2019 (not annualised), agriculture has grown by 11,3% while government is marginally up by 0,8%. All other industries are down, with construction (-20,0%), transport and communication (-15,6%), and manufacturing (-14,9%) the worst affected.
Household spending and exports rise
Stats SA also measures the expenditure side of GDP, reflecting the demand side of the economy. Expenditure on GDP increased by 13,8% in the third quarter, giving an annualised rate of 67,6%. The rebound was dominated by increased household spending and a rise in exports.
Taking advantage of easing restrictions, South African consumers ramped up their spending. The biggest contributors to household expenditure in the third quarter were transport; alcoholic beverages and tobacco; food and non-alcoholic beverages; and clothing and footwear. Spending on restaurants and hotels recorded an annualised surge of 7 043%.
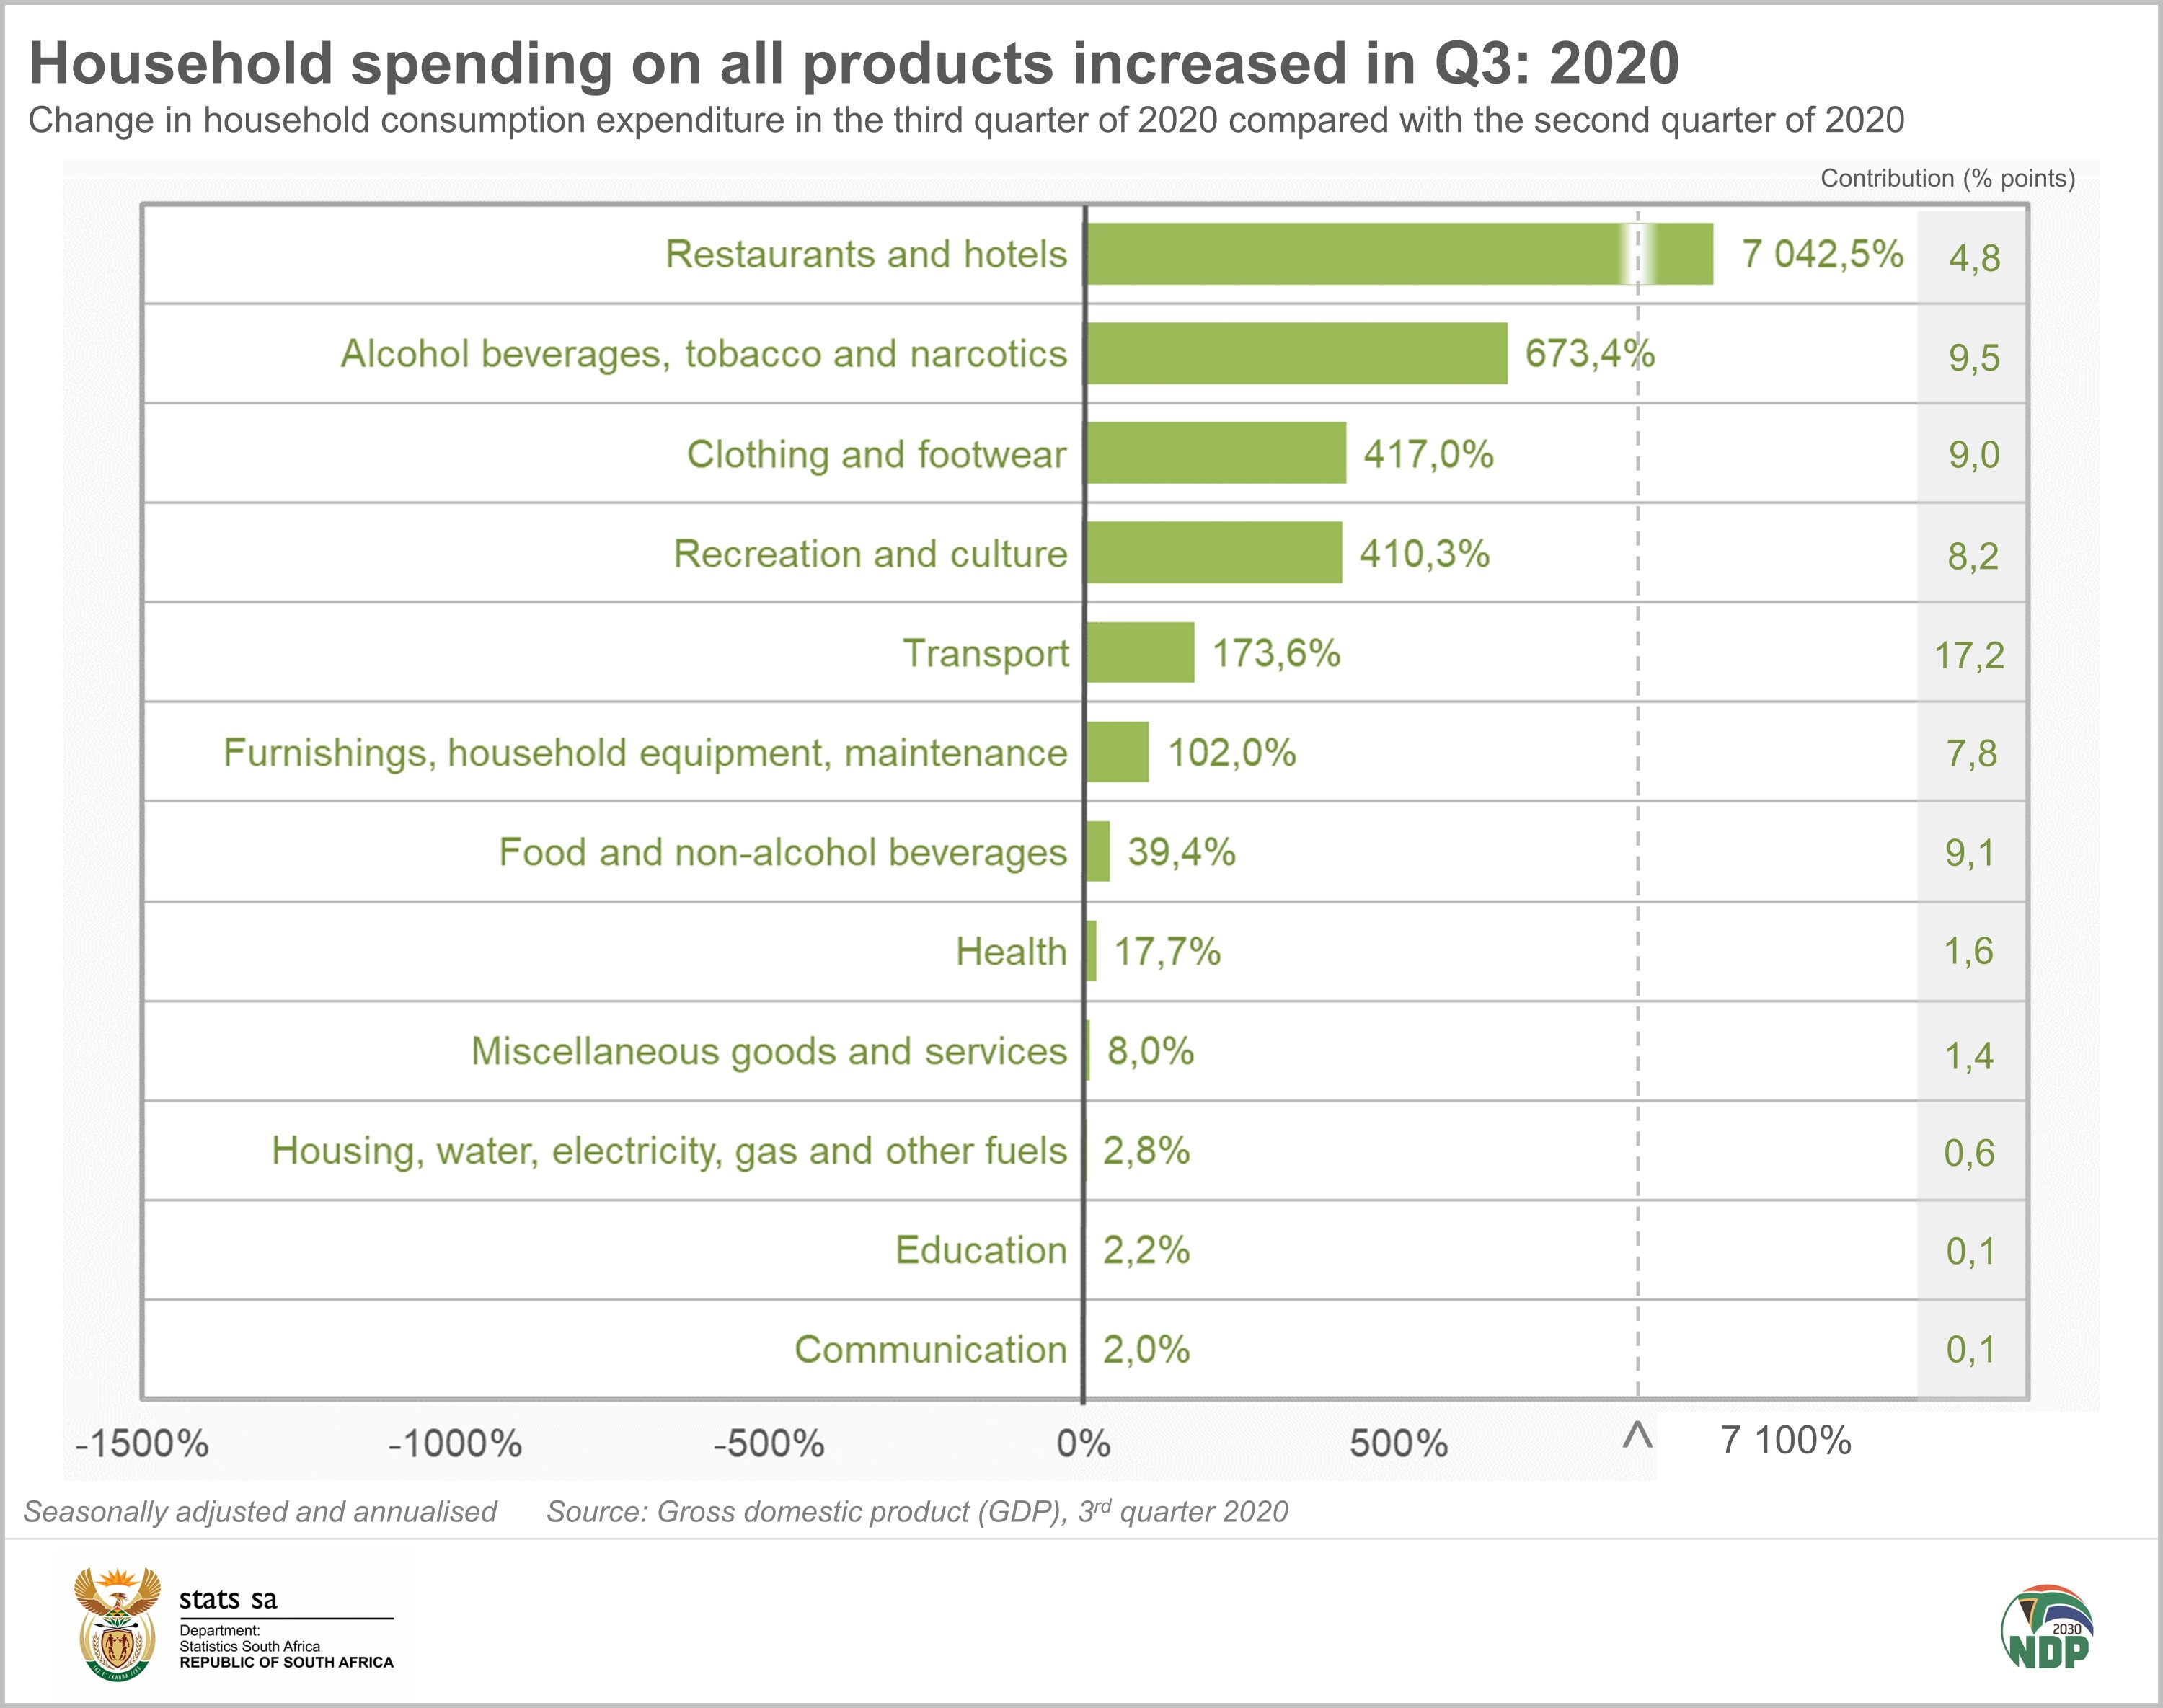
Despite this rebound, household expenditure is still subdued compared with the third quarter of 2019, down 4,8% (not annualised). The rise in spending on restaurants and hotels might seem meteoric, but it is still half of what it was in the same period last year.
Exports increased at an annualised rate of 201,4% in the third quarter of 2020, driven mostly by increased trade in vehicles and transport equipment; precious metals and stones; machinery and equipment; and mineral products.
Imports were down in the third quarter, declining at an annualised rate of 1,6%.
As an interesting aside, the fall in imports since the beginning of the pandemic has resulted in a lower supply of goods in the economy. This has forced many businesses to draw from their inventories in order to meet the rise in demand for goods as lockdown restrictions have eased.
There was a drawdown of R31,6 billion (unadjusted, not annualised) in inventories across the economy in the third quarter, the biggest drawdown in a single quarter in at least the last decade. The trade industry was a major contributor to the drawdown, as well as the mining and manufacturing industries.
For more information, download the Q3: 2020 GDP release, media presentation and the associated Excel files here.
Measuring GDP growth
Economic growth can be reported in a number of different ways. Annual, quarter-on-quarter and year-on-year growth are terms that are often used in the context of GDP.
The following is a breakdown of these terms. Each has its own use and describes economic performance from a slightly different angle. When analysing economic growth, it is best to consider all the measures to gain a more complete picture of how the economy is performing.
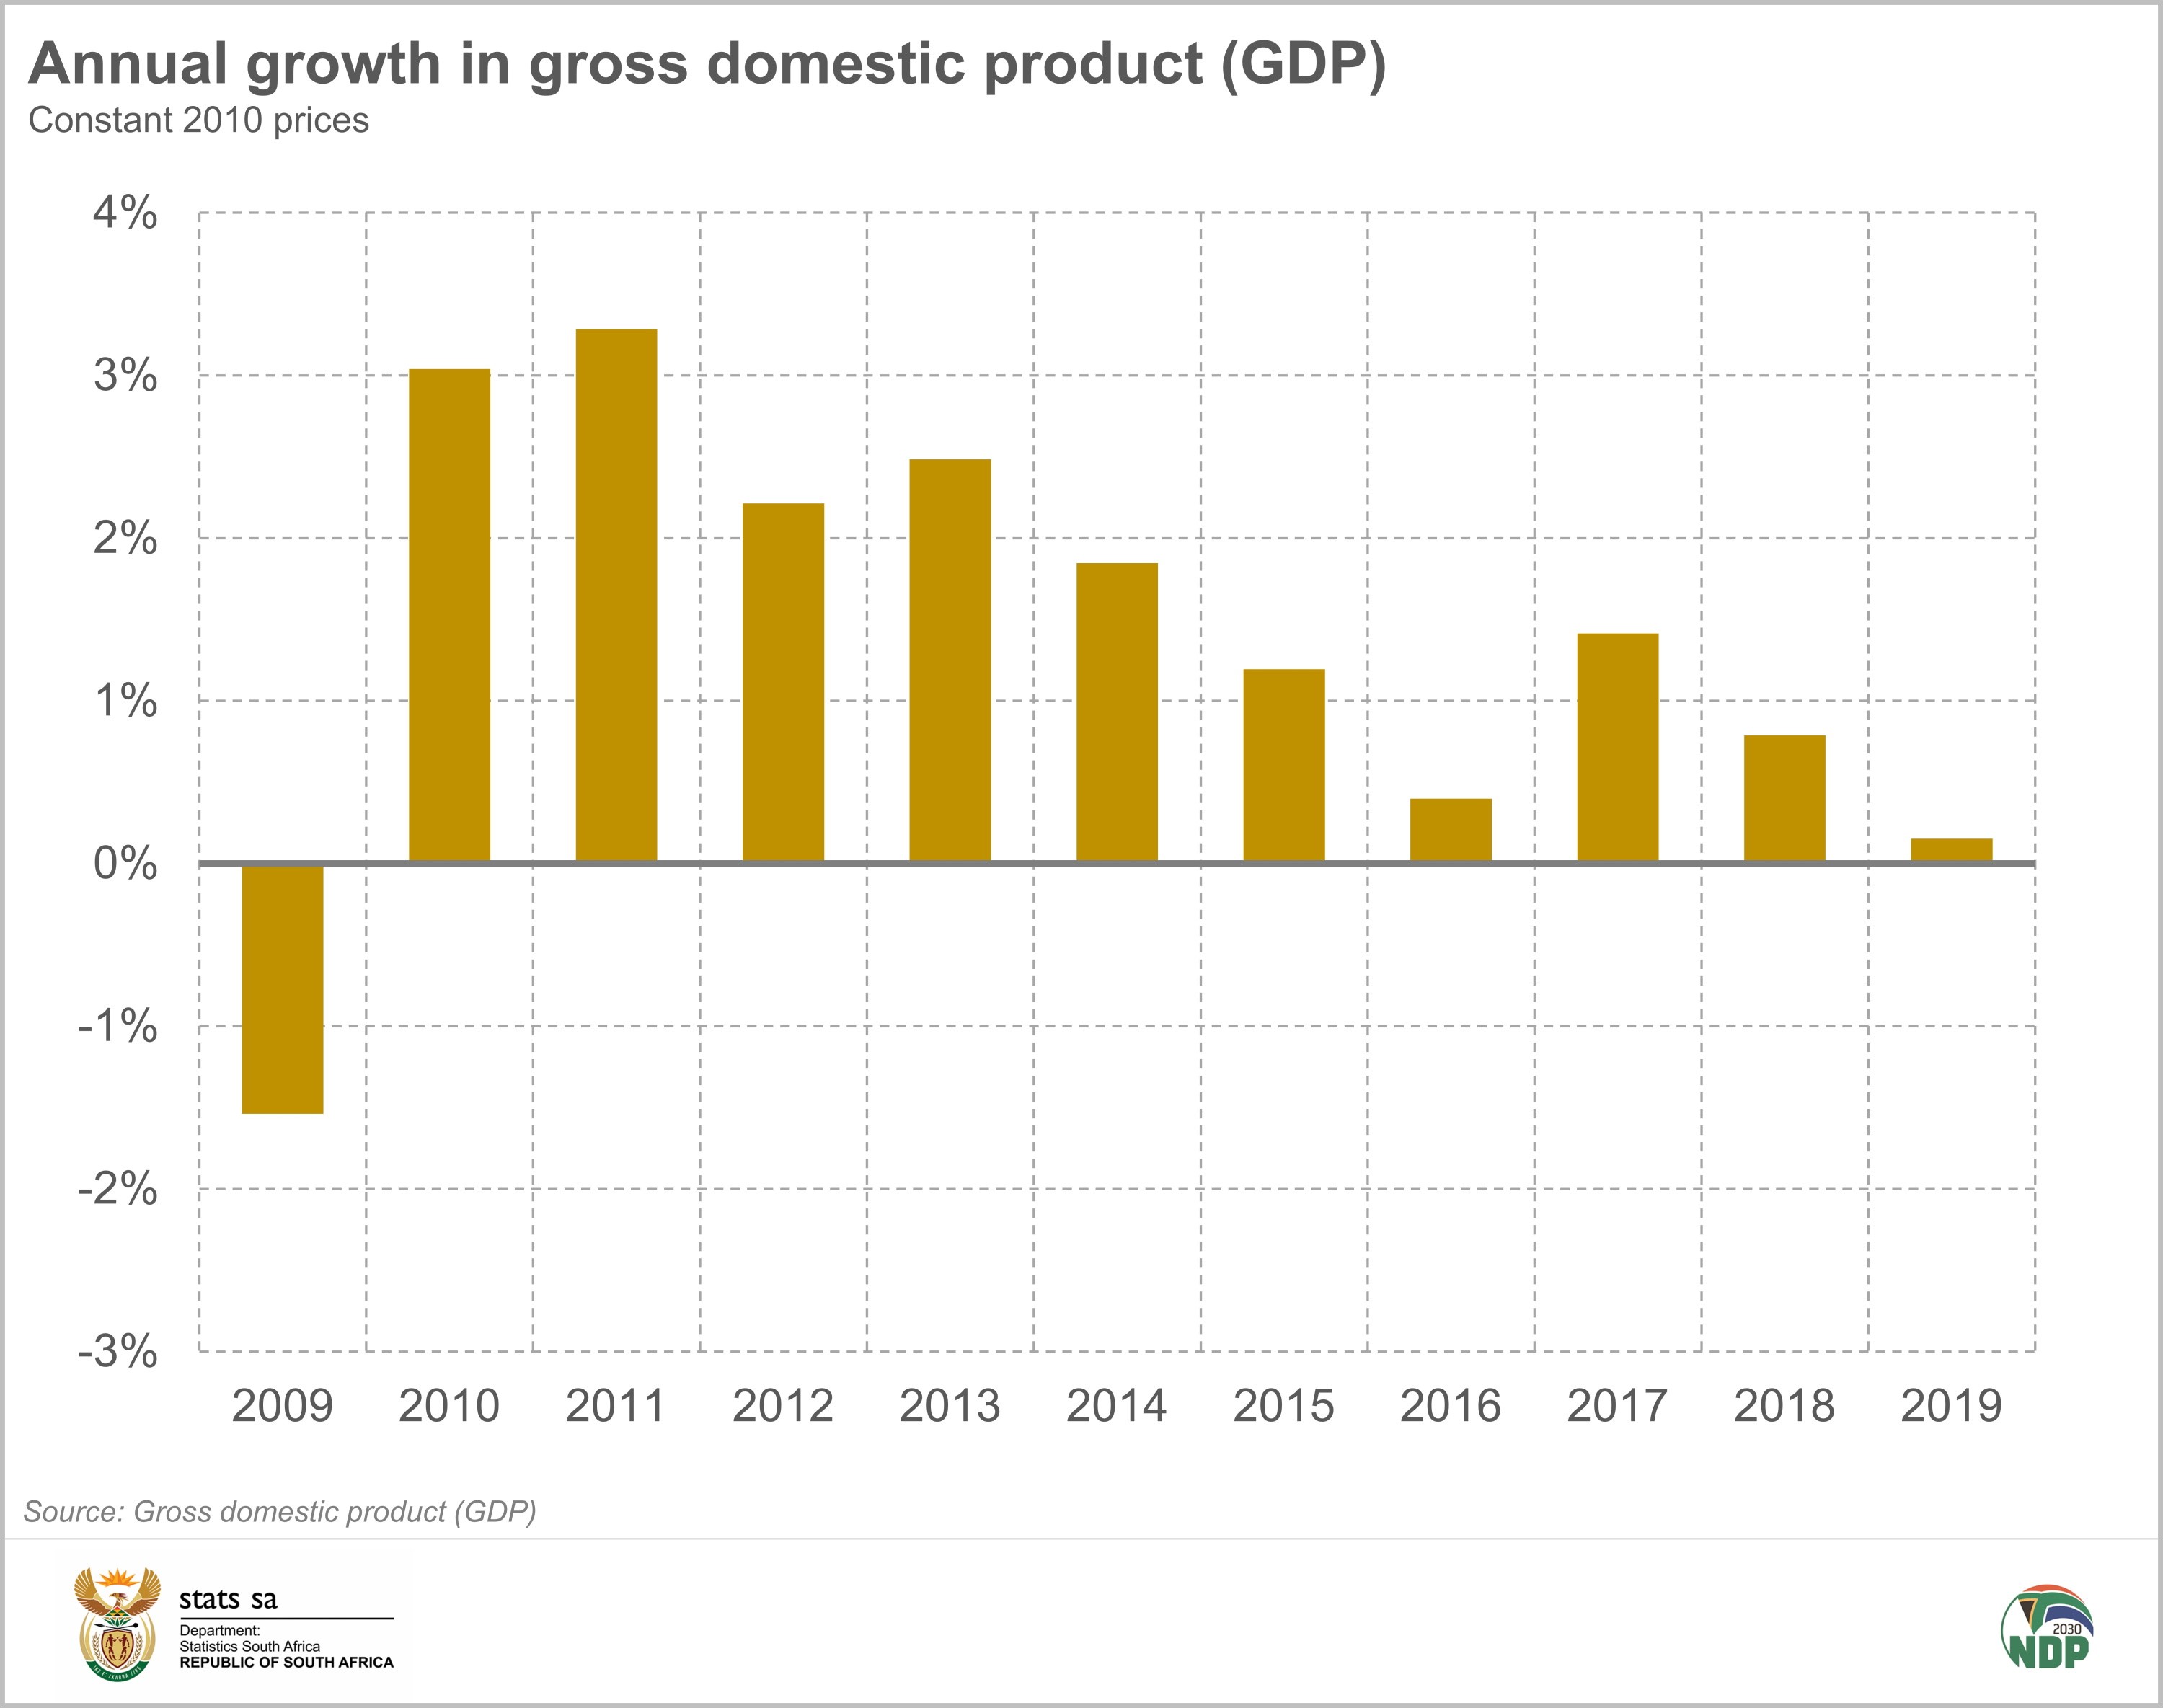
Annual growth
This represents the percentage change in GDP from one year to the next, providing a country’s annual rate of economic growth. For example, South Africa’s real GDP in 2018 was R3 144,5 billion, increasing to R3 149,3 billion in 2019 (constant 2010 prices). This represents an annual GDP growth rate of 0,2%.
Year-on-year growth
This represents the percentage change in GDP for a quarter compared with the same quarter in the previous year. For example, real GDP was R810 billion in the fourth quarter of 2018 compared with R806 billion in the fourth quarter of 2019. This represents a year-on-year decline of 0,5%.
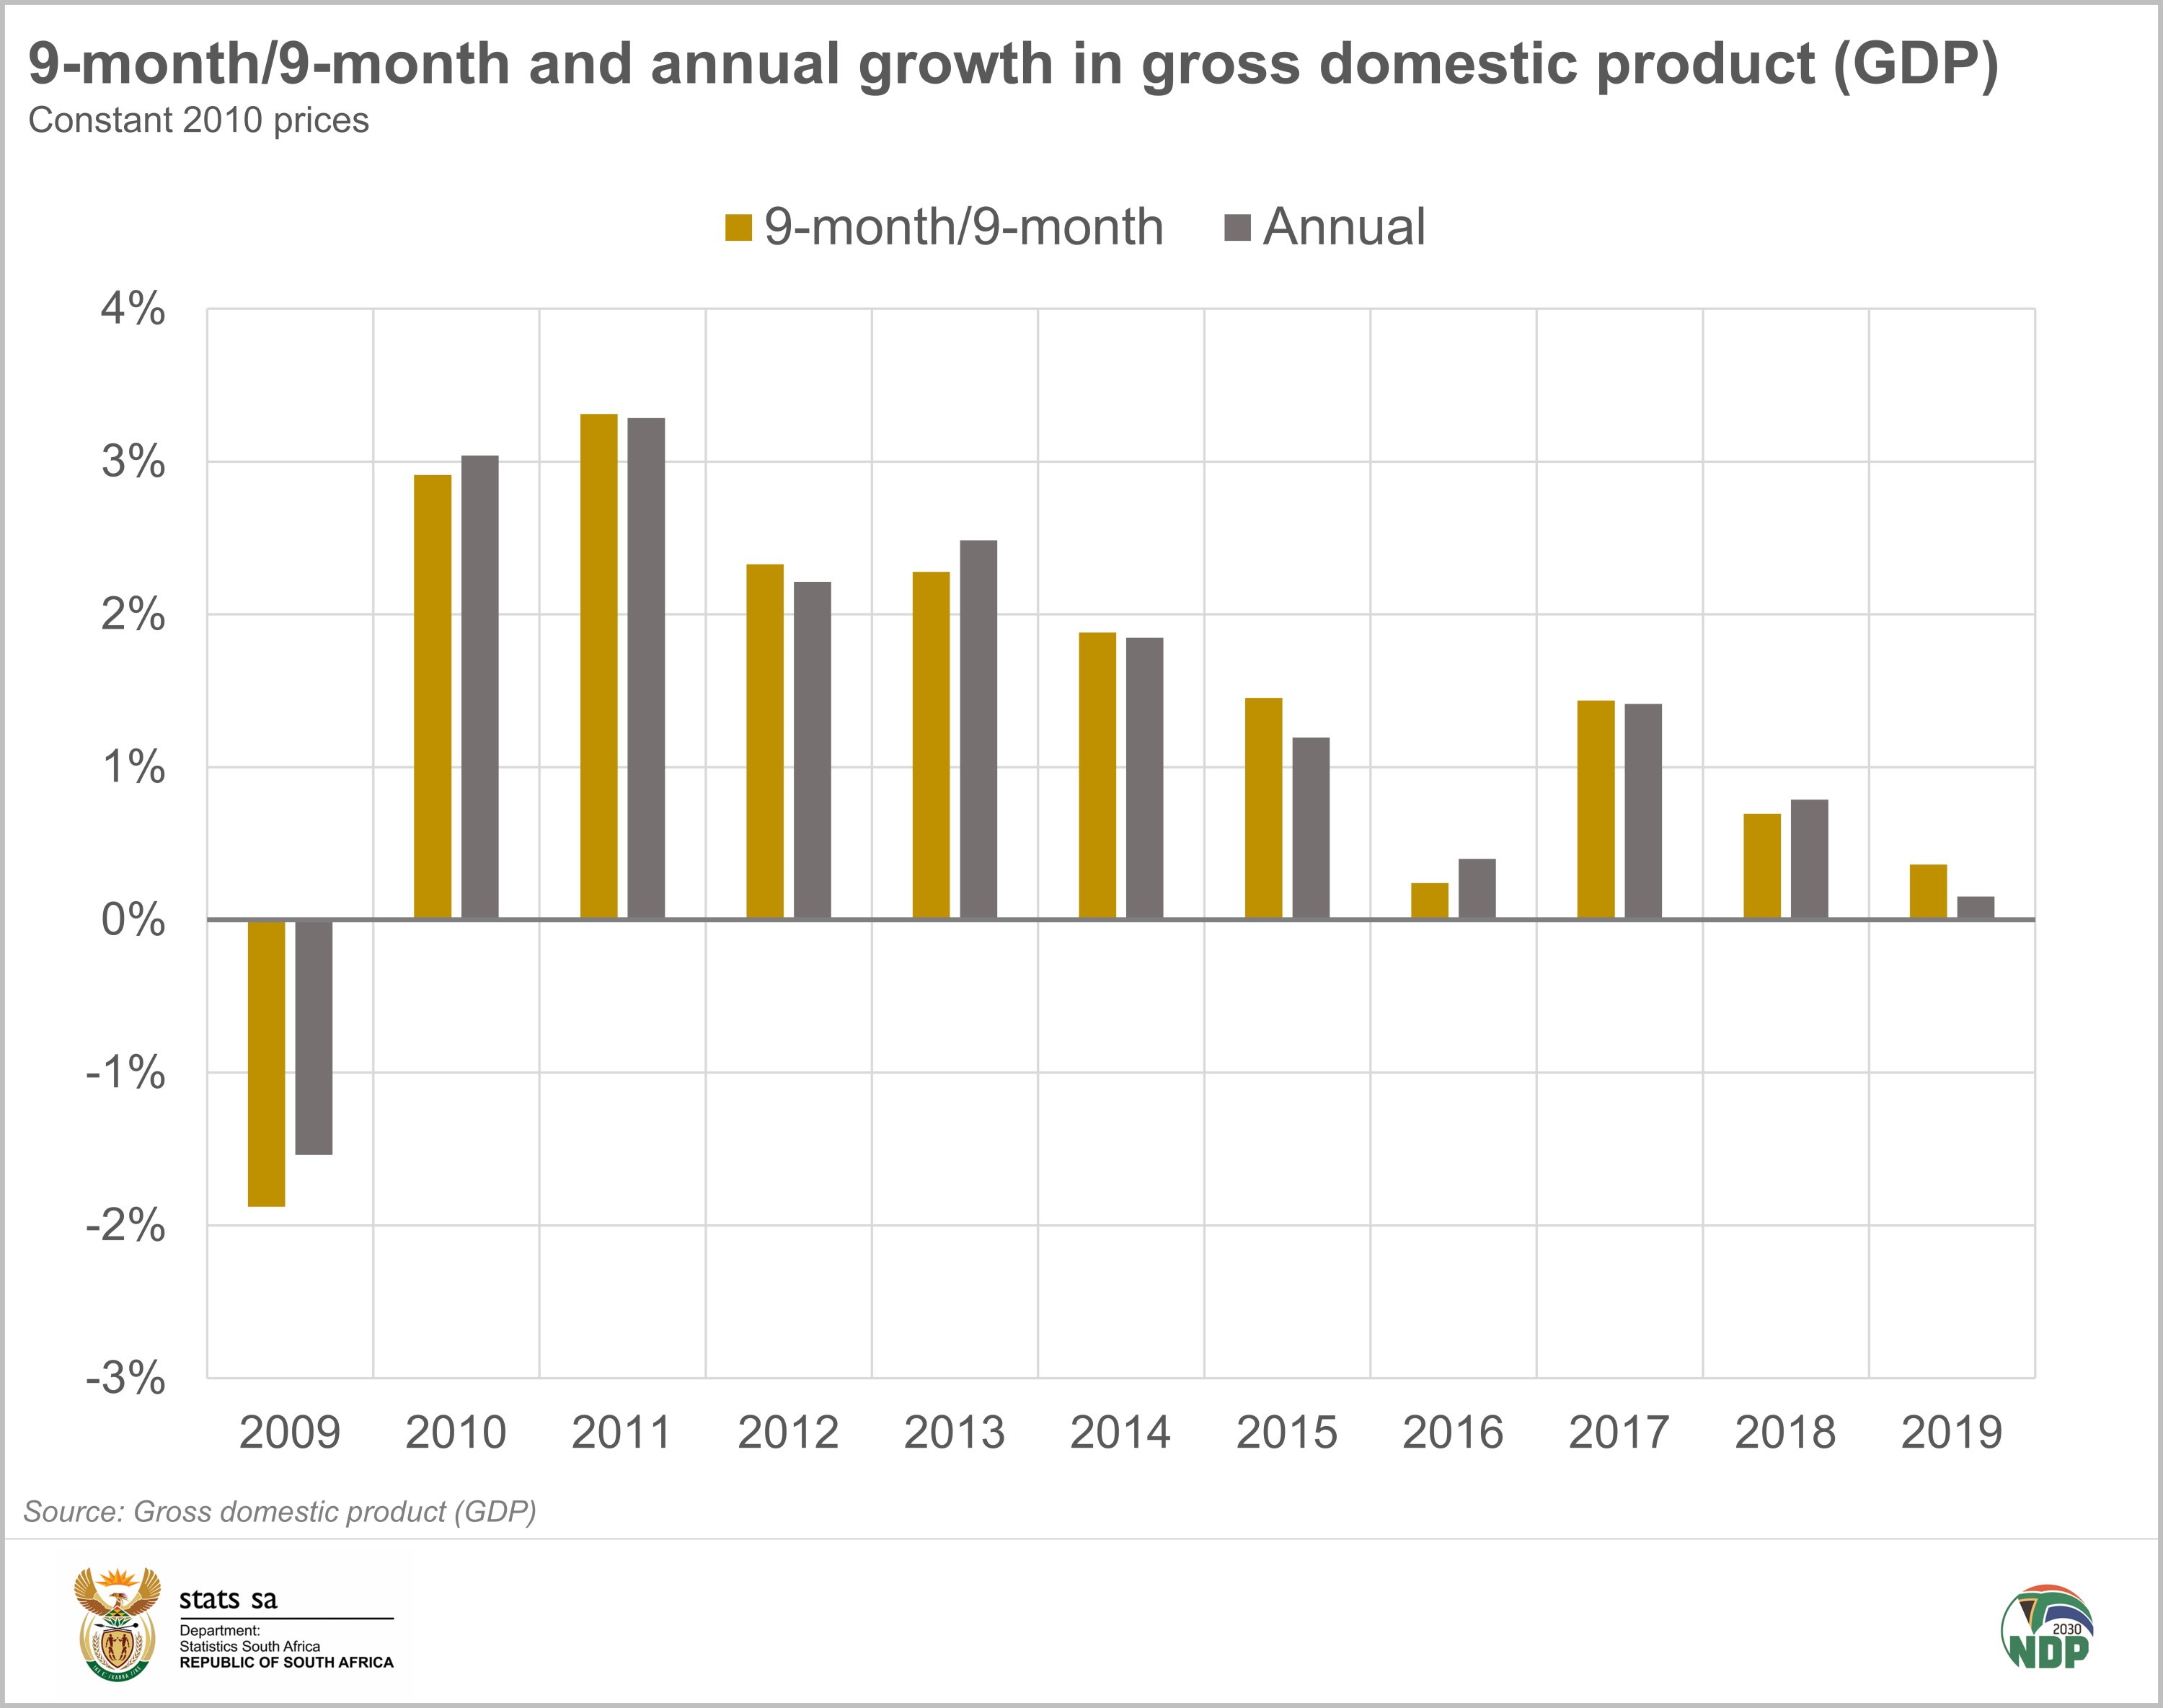
Year-on-year growth is also calculated on a year-to-date basis, by considering the first two quarters of the year (referred to as 6-month/6-month growth) or the first three quarters of the year (referred to as 9-month/9-month growth). For example, real GDP amounted to R2 334,9 billion in the first three quarters of 2018 compared with R2 343,4 billion in the first three quarters of 2019. This represents a 9-month/9-month growth rate of 0,4%.
Quarter-on-quarter growth
This represents the percentage change in GDP for the latest quarter compared with the immediate preceding quarter (for example, Q3: 2020 compared with Q2: 2020).
Seasonal adjustment
One complication that arises with quarterly GDP is that of seasonal patterns. Think of weather conditions that influence agriculture production over the course of the year; the Easter holidays and the festive season that influence trade, transport and accommodation; and year-end closures that have an impact on construction and other businesses.
These seasonal patterns make quarter-on-quarter comparisons very difficult to make. To calculate meaningful quarter-on-quarter growth rates, these seasonal patterns are estimated and removed from the data. This is what it means when Stats SA says the data have been ‘seasonally adjusted’.
Annualisation
The quarter-on-quarter growth rate can also be annualised to show what the annual (i.e. year-on-year) rate would be if the quarter-on-quarter rate were to occur four times in a row. The annualised rate provides a crude forecasting model that is useful in times of stable economic performance, but less so in a highly volatile environment.
One might think that to annualise a quarter-on-quarter rate, you simply multiply the rate by four, as there are four quarters in a year. For example, if the quarter-on-quarter rate is 2,0%, does that mean the annualised rate is 8,0%?
It’s not that simple. The annualised rate is calculated using a formula that takes the effect of compounding into account. When the quarter-on-quarter rate is positive, the annualised rate is more than four times the quarter-on-quarter rate. So 2,0% becomes 8,2% (after rounding).3 This can be thought of as a ‘positive compounding effect’.
When the quarter-on-quarter rate is negative, the annualised rate is less than four times the quarter-on-quarter rate (in absolute terms). So -2,0% becomes -7,8% (after rounding).4 This can be thought of as a ‘negative compounding effect’.
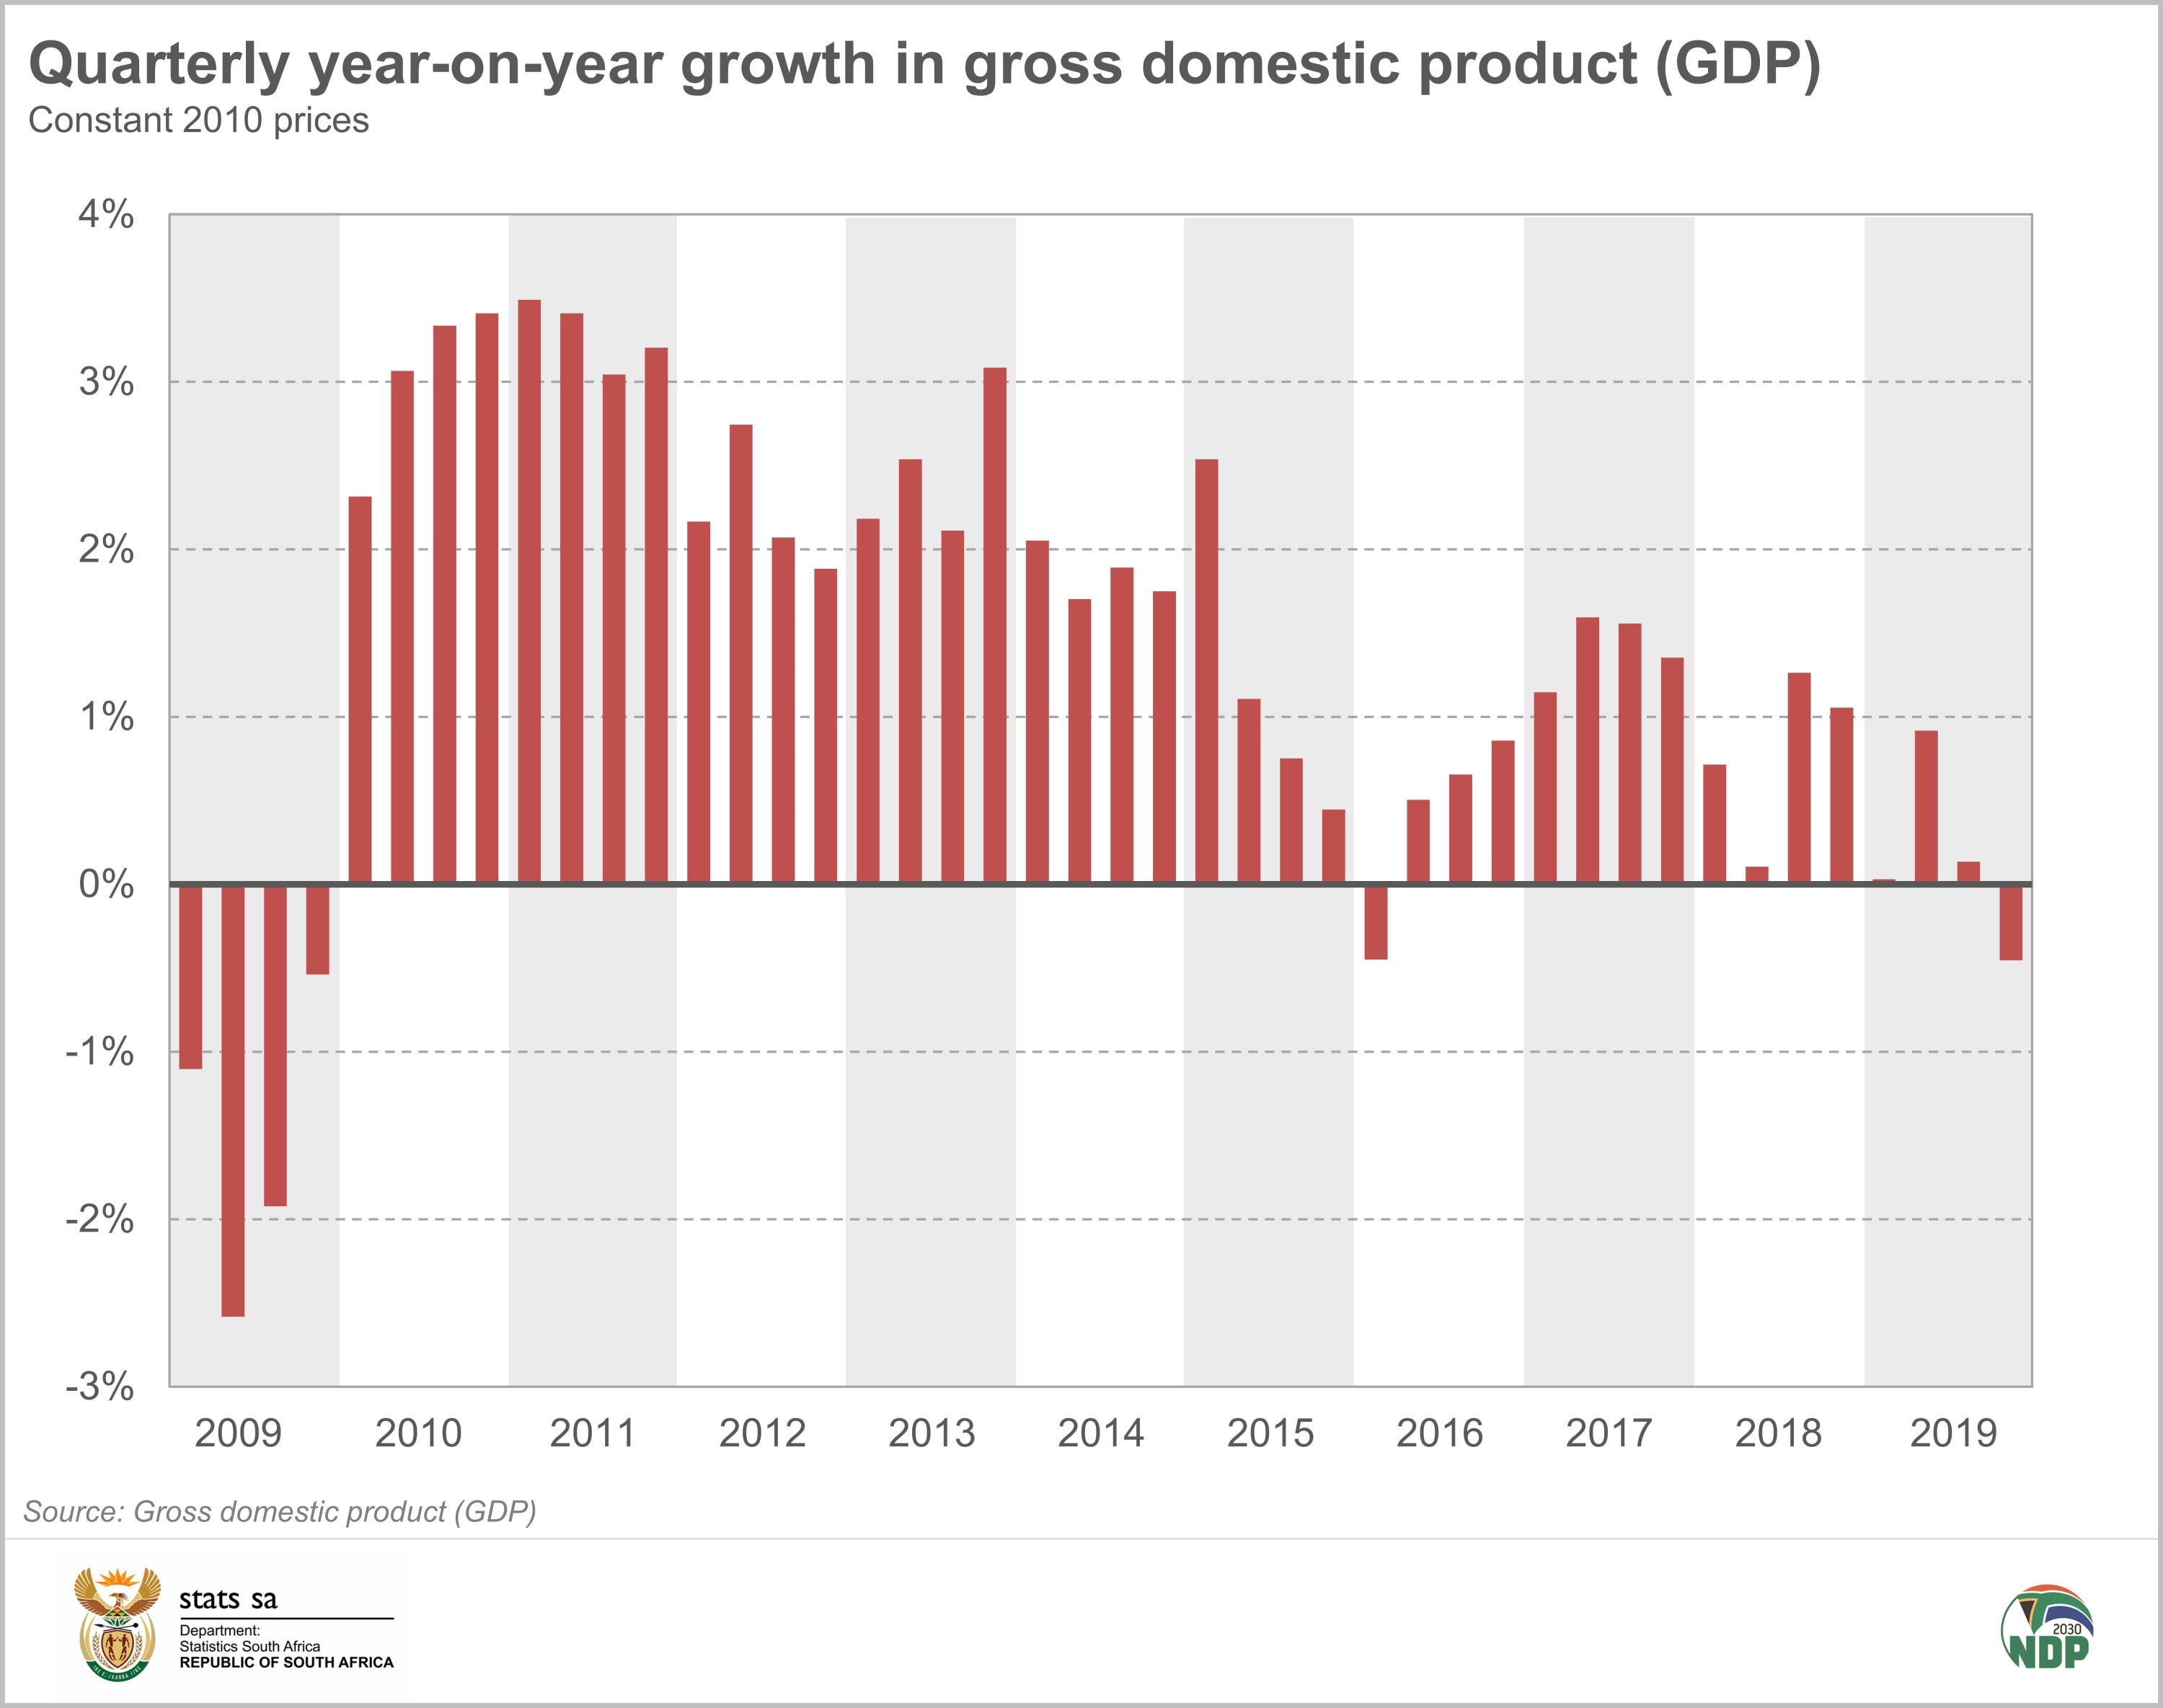
The chart below shows the quarter-on-quarter rate (not annualised) against the annualised quarter-on-quarter rate.
- The blue bars show the quarter-on-quarter growth rate.
- The blue and orange bars together add up to the quarter-on-quarter annualised growth rate.
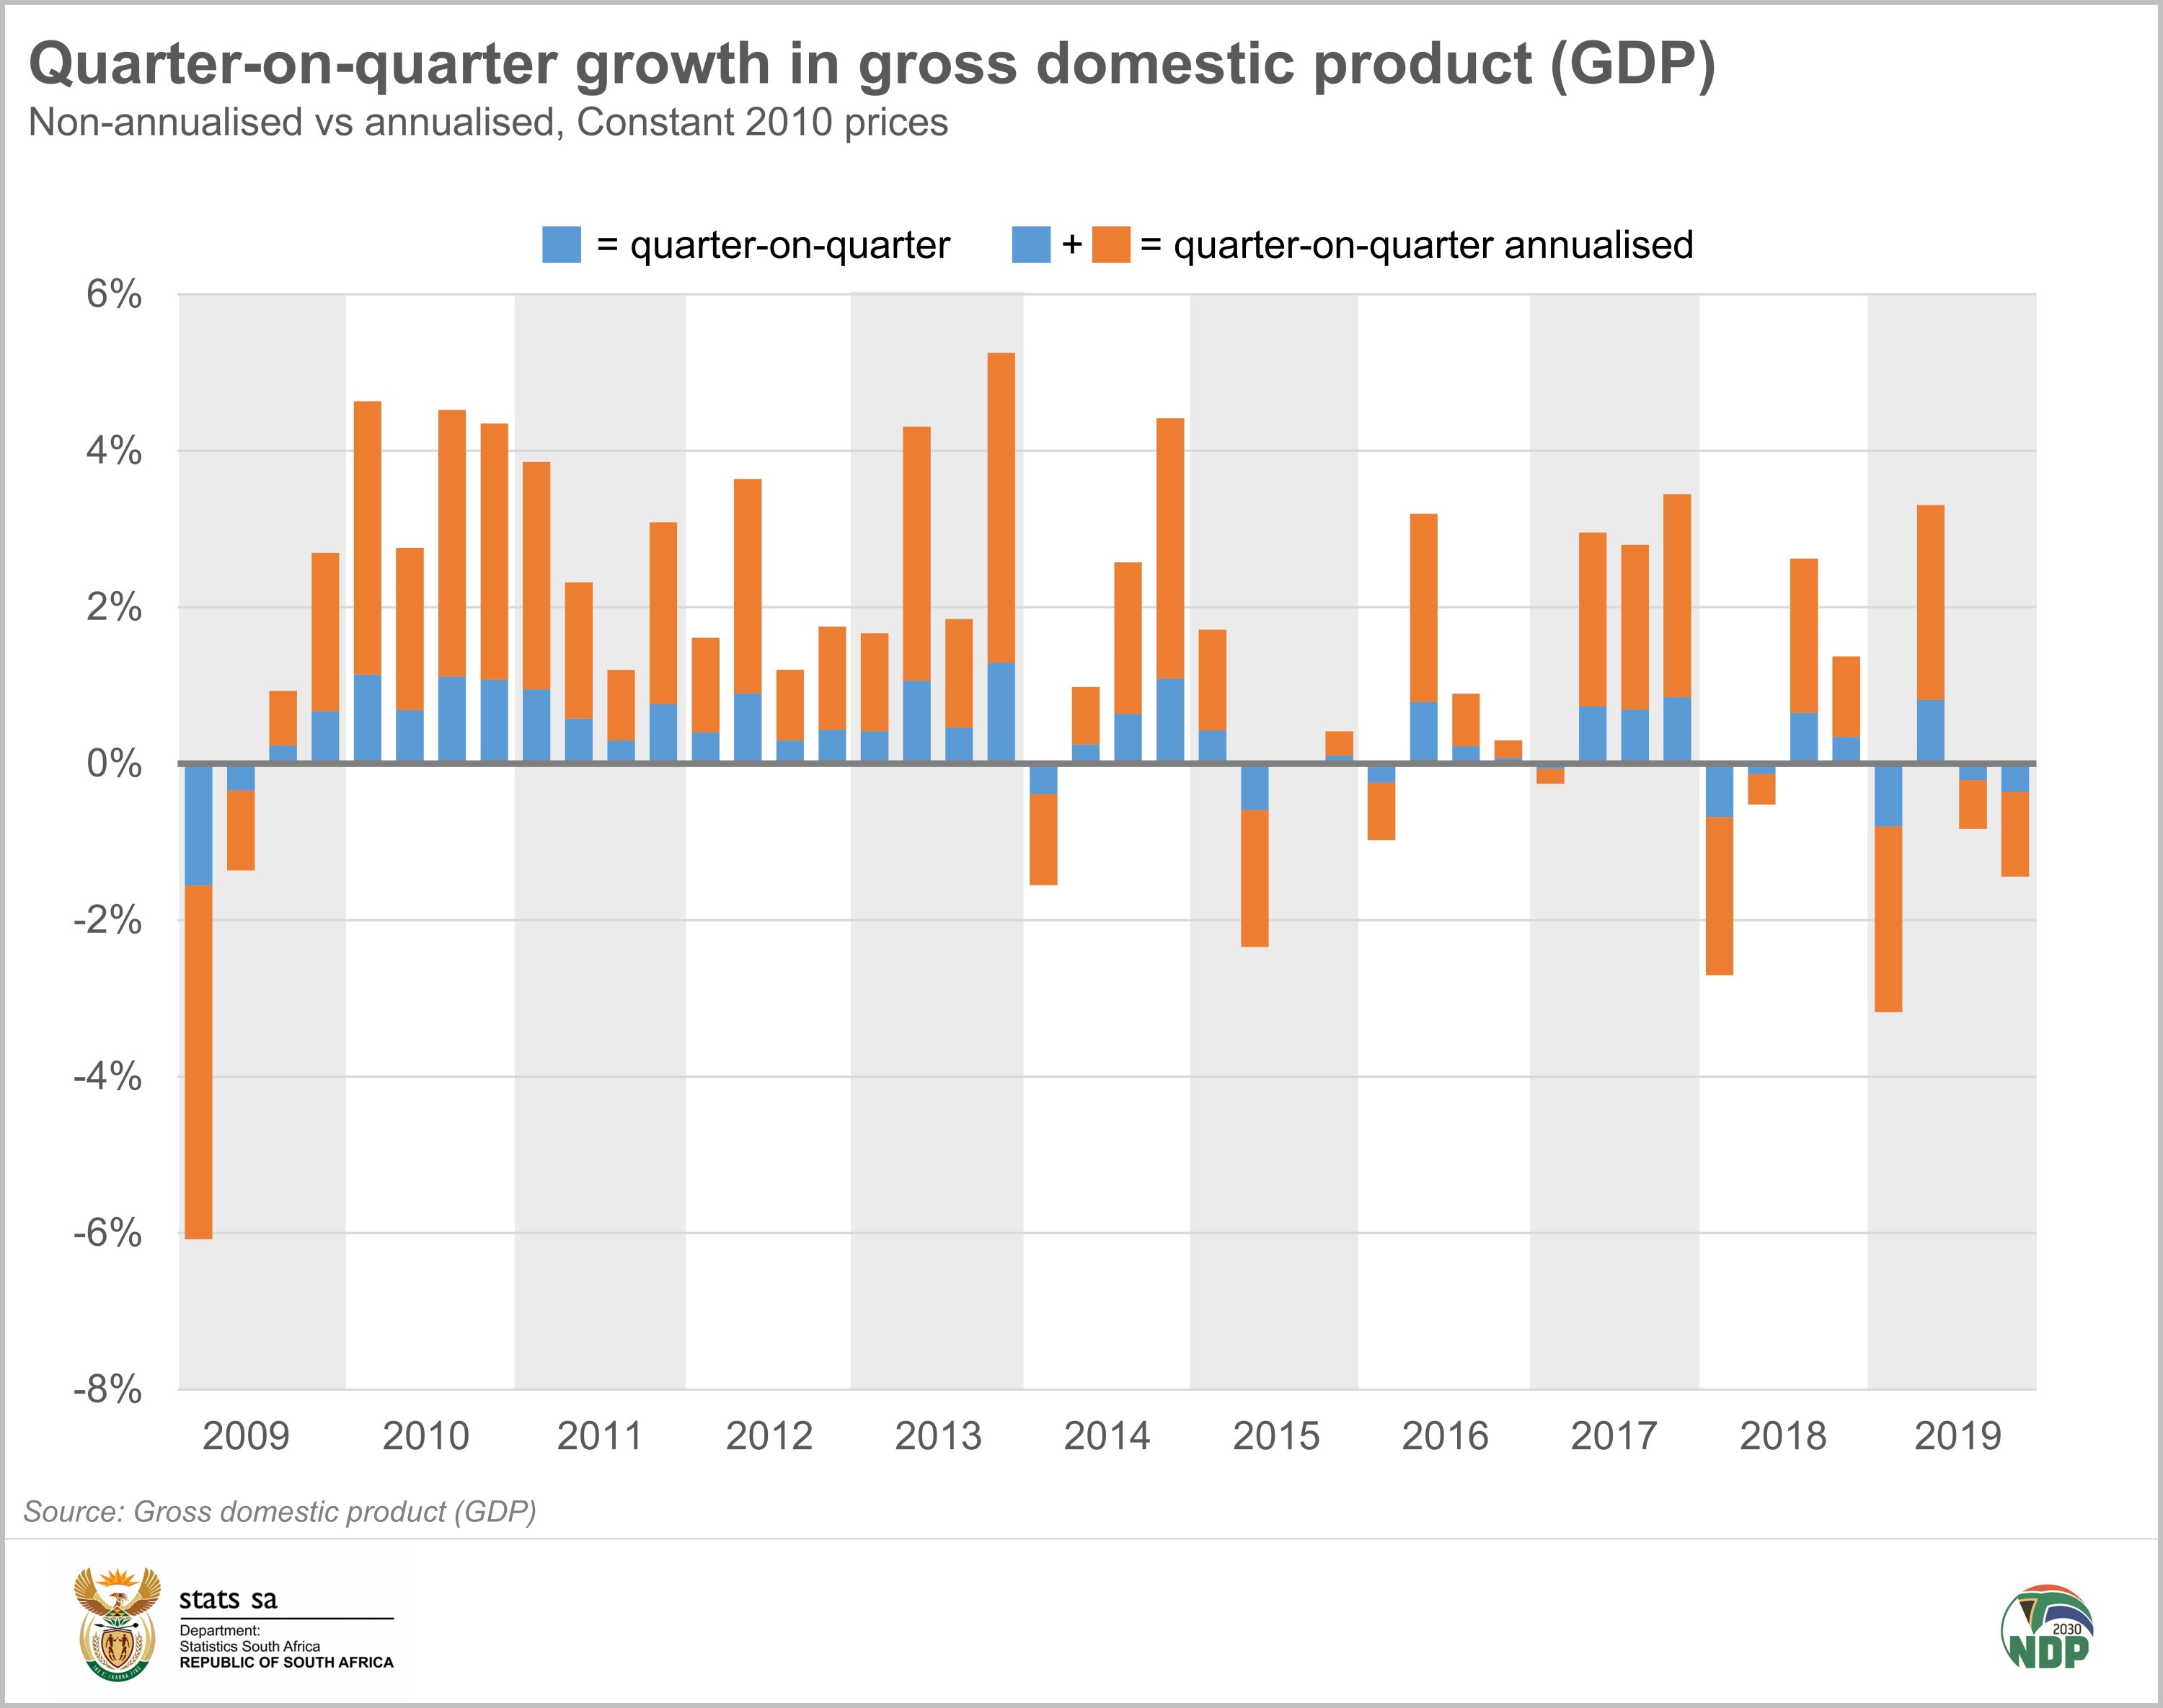
Note that in any given quarter both growth rates always carry the same sign, i.e. both positive or both negative; whereas the quarter-on-quarter growth rate and the year-on-year growth rate may carry different signs in the same quarter.
Stats SA’s headline growth rate
With so many different measures of GDP growth, a statistical agency typically selects one growth figure as its headline rate when it reports GDP results to the media. The headline GDP growth rate for South Africa is the annualised quarter-on-quarter percentage change in GDP estimated by the production approach at constant prices and seasonally adjusted.
Even though there is a headline rate, it is important to take note of all growth rates when examining economic growth. These are published in either the statistical release or in supporting documents. The latest growth figures for South Africa are shown in the table below (all rates have been rounded to one decimal point).

1 Unless otherwise indicated, all growth rates in this article are quarter-on-quarter, seasonally adjusted and annualised, and in real (volume) terms.
2 Seasonally adjusted real GDP in the third quarter of 2020 compared with the fourth quarter of 2019 (not annualised).
3 (1 + 2/100)4 x 100 – 100 = 8,2
4 (1 – 2/100)4 x 100 – 100 = -7,8