
What does government spend money on?
A recent release from Stats SA provides a breakdown of financial data from all 708 institutions in government. This article provides an overview of what government spent money on in 2018/19, with focus on the public service wage bill.
South African general government spent R1,79 trillion in 2018/19, according to the latest Financial statistics of consolidated general government statistical release.1 This roughly translates to about R31 000 per person that year, if we consider South Africa’s population of 57,9 million people.2
General government includes all national and provincial government departments, municipalities, extra-budgetary accounts and funds, and higher education institutions.
Breaking down the spending pie
The graphic below provides a bird’s eye view of spending across these institutions, reflecting the priorities of the South African government. Take education, social protection and health. Together, these three functions accounted for R835 billion, or almost half of total expenditure in 2018/19 (click on the graphic to enlarge).
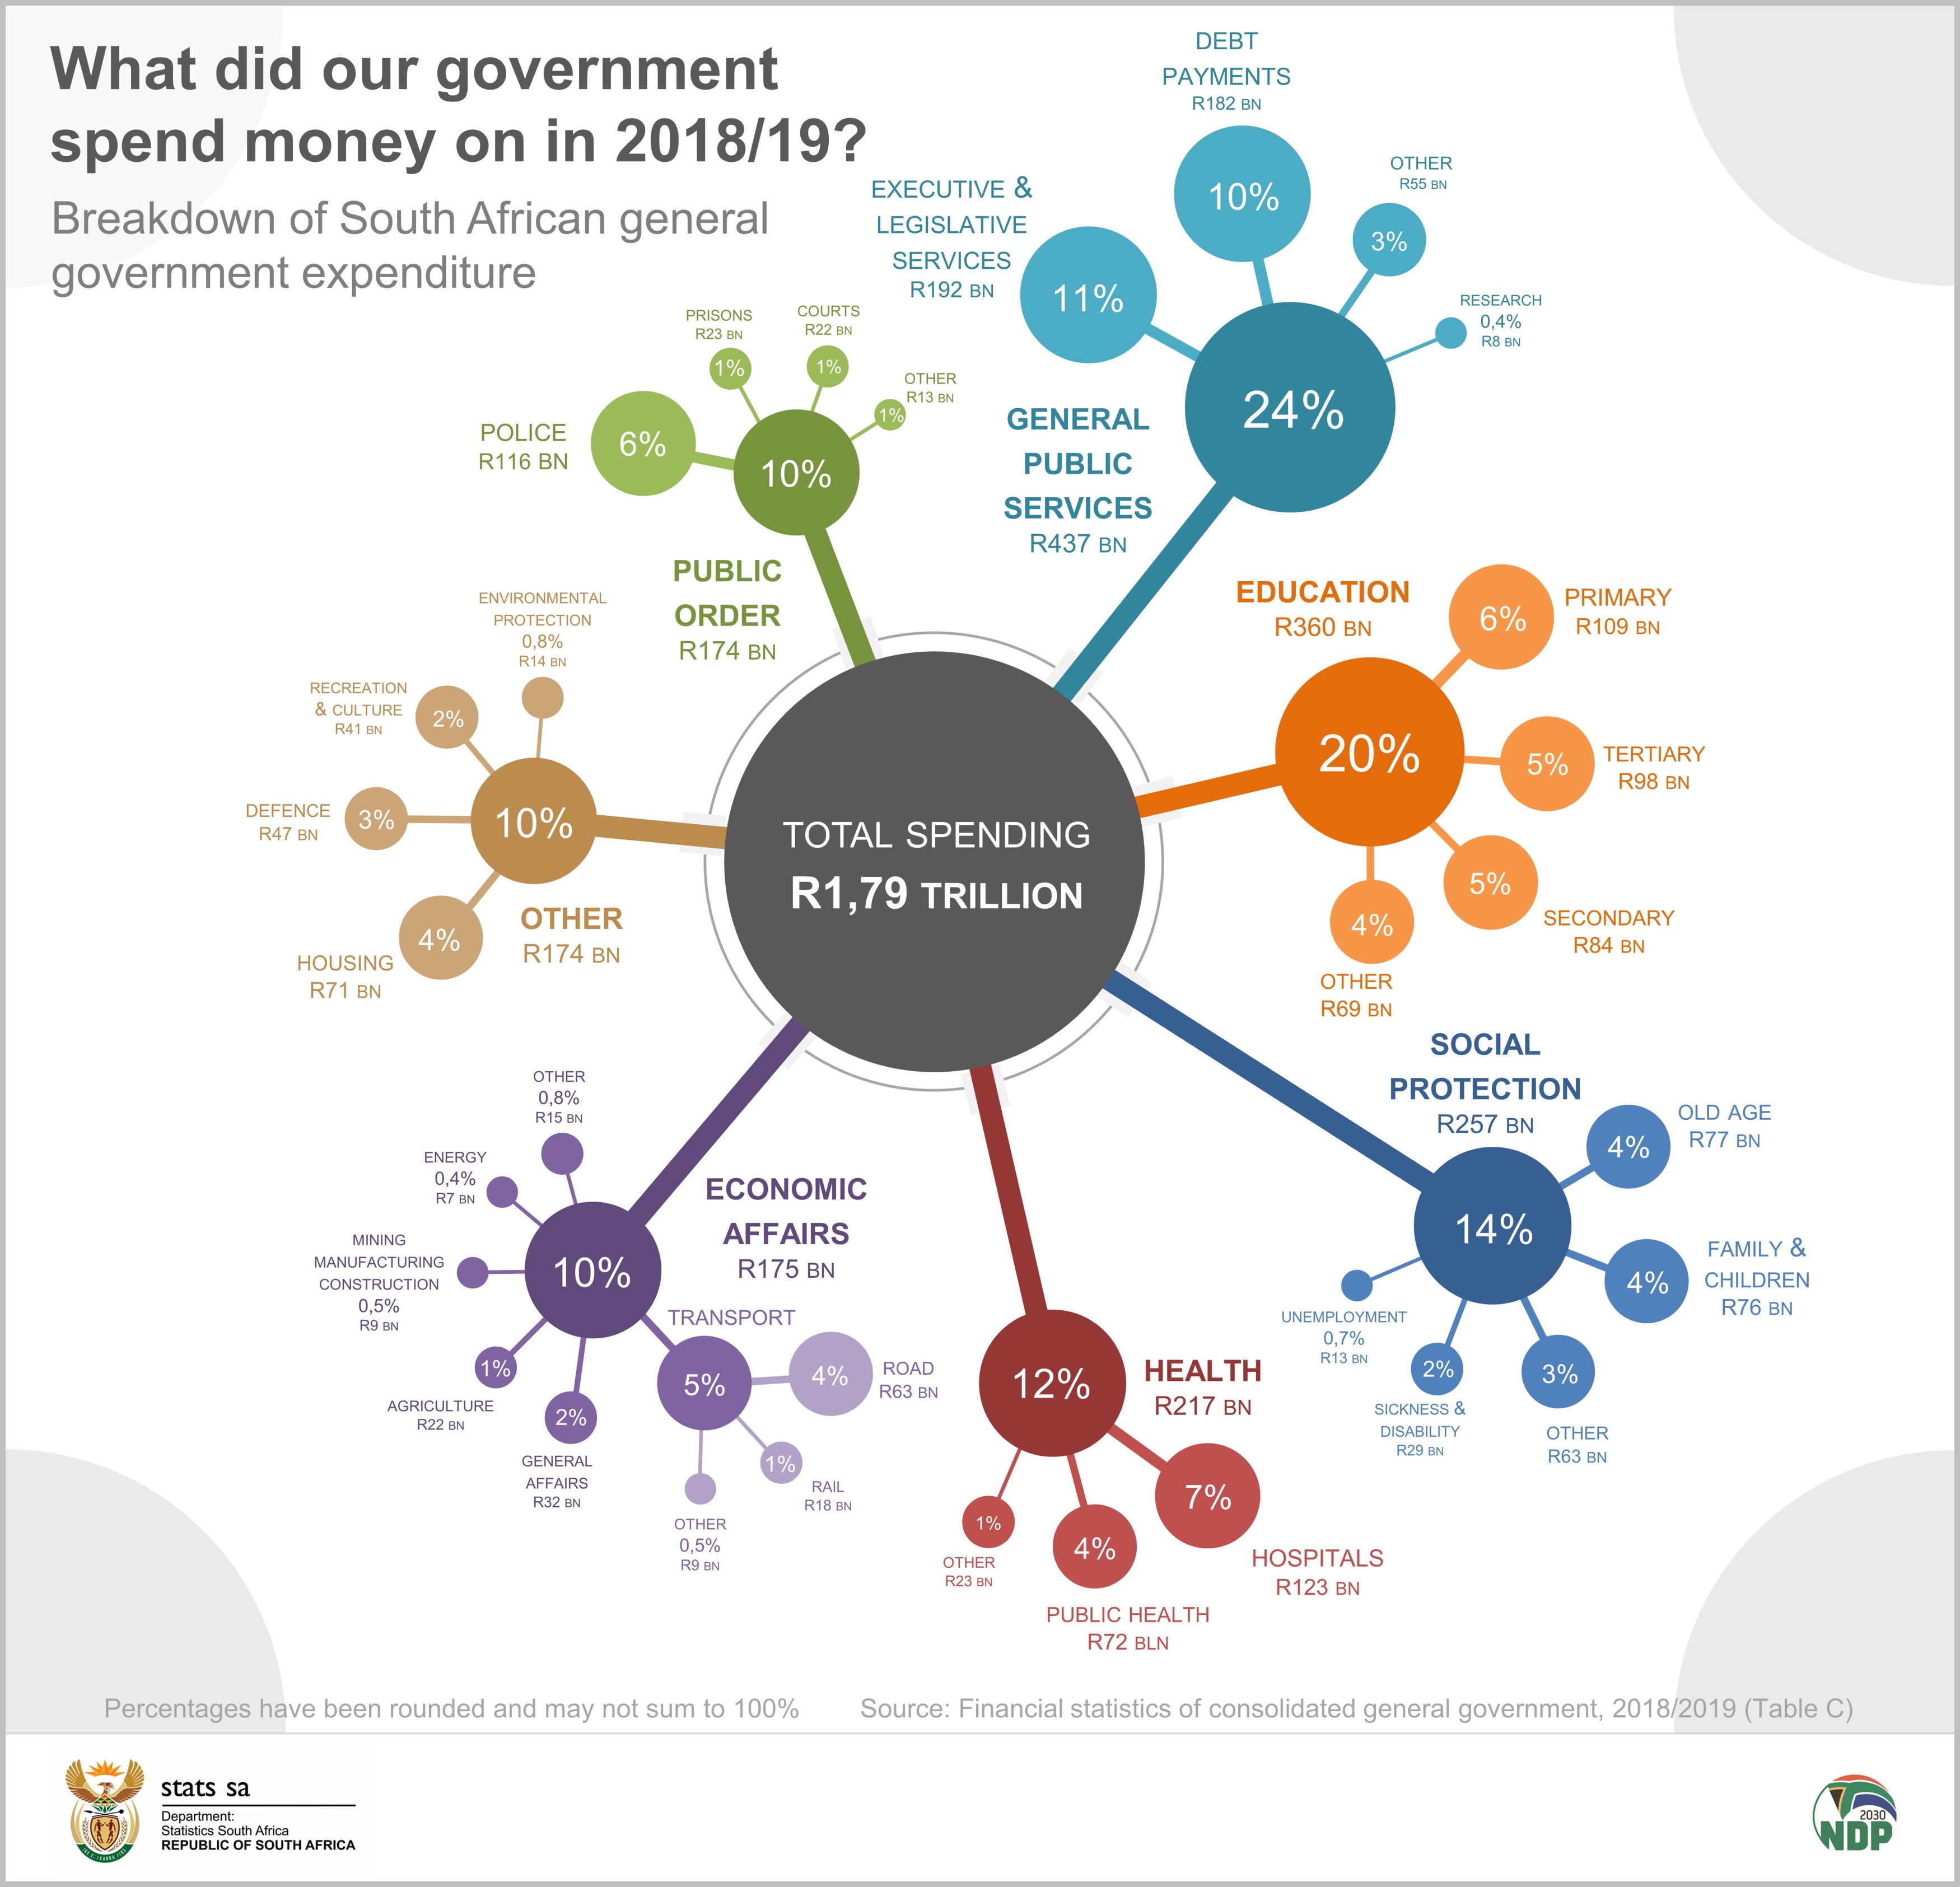
The size of each bubble represents the amount of money spent. Comparing the bubbles across the board highlights some interesting facts:
- Government spends more money on police services than it does on tertiary education or housing.
- Defence accounts for 3% of total spending.
- On the social front, slightly more money was spent on old-age grants than on grants related to family and children (child support, foster care and care dependency grants).
- Environmental protection is one of the smallest items, accounting for 0,8% of total expenditure.
- Executive and legislative services account for 11%. This function includes costs mainly related to the administration of parliament, the provincial legislatures and mayoral offices.
- For every R10 of total government spending in 2018/19, R1 was used on debt payments, including interest payments on debt. This was more than what was spent on either housing, hospitals, tertiary education or police.
Compensation of employees
You may be wondering where employment costs fit in. The graphic expresses government spending in functional terms, so spending on wages and salaries occurs across all the bubbles.
To get an idea of employment costs, we need to rearrange the data into categories that express spending in economic terms. These categories are purchases of goods and services, subsidies, grants paid, interest, social benefits and compensation of employees.
Compensation of employees accounted for R694 billion, or 41,9% of total government expenses in 2018/19.3 This was followed by purchases of goods and services (21,3%) and social benefits (13,6%). Other items accounted for the remaining 23,2%.
The Financial statistics of consolidated general government statistical release debuted in 2006 with data for 2004/05. That financial year, compensation of employees accounted for 39,2% of total expenses, rising to a peak of 42,4% in 2010/11 and moderating slightly to the 41,9% recorded in 2018/19.
The rise in compensation of employees over this period has outstripped inflation. General government spent R170 billion on salaries and wages in 2004/05. This increased to R694 billion in 2018/19, representing an average annual growth rate of 10,5% per year. The consumer price index, in contrast, increased by an average of 5,8% per year over this period.4
National Treasury has identified two drivers behind the rise in compensation spending: an increase in the number of personnel numbers and a rise in remuneration.
The rise in remuneration, which has had the most impact, was driven by three main factors: the introduction of occupation-specific dispensations (i.e. once-off salary increases for skilled staff) near the end of the 2000s; the addition of annual cost-of-living adjustments to basic pay; and wage progression within ranks and promotion between ranks, which have, on average, pushed up civil service remuneration by one full rank over time.5
The introduction of occupation-specific dispensations in particular seems to show up in the data. A time series from the Financial statistics of consolidated general government statistical release shows notable annual increases in compensation of employees from 2007/08 to 2011/12, increasing on average by 14,5% per year over this period. The average annual increase for the next five years (2012/13 to 2016/17) was lower at 8,8%.
How is the wage bill distributed? Health and education accounted for over half of the compensation budget in 2018/19. This was mostly to finance the vital roles that doctors, nurses and teachers perform for a growing population. Public order and safety – which includes personnel working in the police, correctional services and the courts – accounted for almost 20% of total compensation of employees.
Download the Financial statistics of consolidated general government 2018/2019 release here. When interpreting these figures, note that (a) the data are adjusted for the reference period 1 April – 31 March and (b) in order to compare across all levels of government, data are converted from an accrual basis of recording to a cash basis of recording.
1 The total includes capital expenditure.
2 2018 estimate. From Stats SA, Mid-year population estimates, 2020. Country projection by population group, sex and age (2002-2020) Excel file (download here).
3 Total expenses excludes capital expenditure.
4 Stats SA, CPI historical tables, Table B1 (available here).
5 National Treasury, Mid-term budget policy statement, 2020, Section B, page 58 (read here).
Similar articles are available on the Stats SA website and can be accessed here.
For a monthly overview of economic indicators and infographics, catch the latest edition of the Stats Biz newsletter here.