
An update on municipal finances for the quarter ending June 2020
Even though South Africa’s 257 municipalities increased their spending in the quarter ended June 2020, the rise was slower than increases recorded in previous quarters.
Spending increases by 4,6%
Local government spent R105,9 billion in the quarter ended June 2020, up by R4,6 billion (or 4,6%) compared with the quarter ended June 2019, according to the latest Quarterly financial statistics of municipalities statistical release.1
This rise is lower than year-on-year increases recorded in the quarters ended June 2019 (14,6%), September 2019 (15,4%), December 2019 (11,5%), March 2020 (11,3%).
This is attributed to a decline in expenditure on items such as general expenses, repairs and maintenance, and ‘other’ expenditure.
Municipalities spent R973 million less on general expenses in the quarter ended June 2020 compared with the quarter ended June 2019. The biggest decreases were recorded for plant and equipment hire (down by R570 million), consultancy and professional fees (down by R240 million), fuel and oil (down by R165 million) and transport costs (down by R135 million).
Expenditure on repairs and maintenance eased by R689 million.
‘Other’ expenditure includes items such as collection costs, impairment loss, departmental fees, consumables, refreshments and sundries. The ‘other’ expenditure line item recorded a decrease of R371 million.
At first glance, the decline in ‘other’ expenditure might appear counter-intuitive to those familiar with municipal finances. The procurement of personal protective equipment (PPE) by municipalities during the COVID-19 pandemic would be recorded under this line item, driving up expenditure.
The quarter ended June 2020 covers the lockdown months of April, May and June. A number of municipalities indicated that the lockdown period disrupted their operations, resulting in a backlog of uncaptured invoices, including those for PPE. When these invoices are eventually processed, the amounts should reflect in future municipal reports and eventually in Stats SA’s statistical release.
If we compare the change in overall spending in the quarter ended June 2020 with the quarter ended March 2020, total expenditure increased by 10,7%. This is lower than the 17,8% rise recorded over the corresponding period in 2019. General expenses again was the line item recording the biggest decrease, declining by R1,1 billion in the quarter ended June 2020 compared with the quarter ended March 2020.
On the revenue side, local government generated or received R105,4 billion in the quarter ended June 2020, R7,3 billion more than the R98,2 billion recorded in the quarter ended June 2019 – a rise of 7,4%.
What were the biggest positive drivers of spending and income?
Focussing on the R4,6 billion year-on-year expenditure increase in the quarter ended June 2020, the data show that the biggest drivers behind this rise were employee costs (up by R3,0 billion), bad debts (up by R2,0 billion) and purchases of electricity (up by R1,2 billion).2
Employee costs, which includes salaries and wages of municipal staff, contributed R29,7 billion (or 28,1%) to total spending.
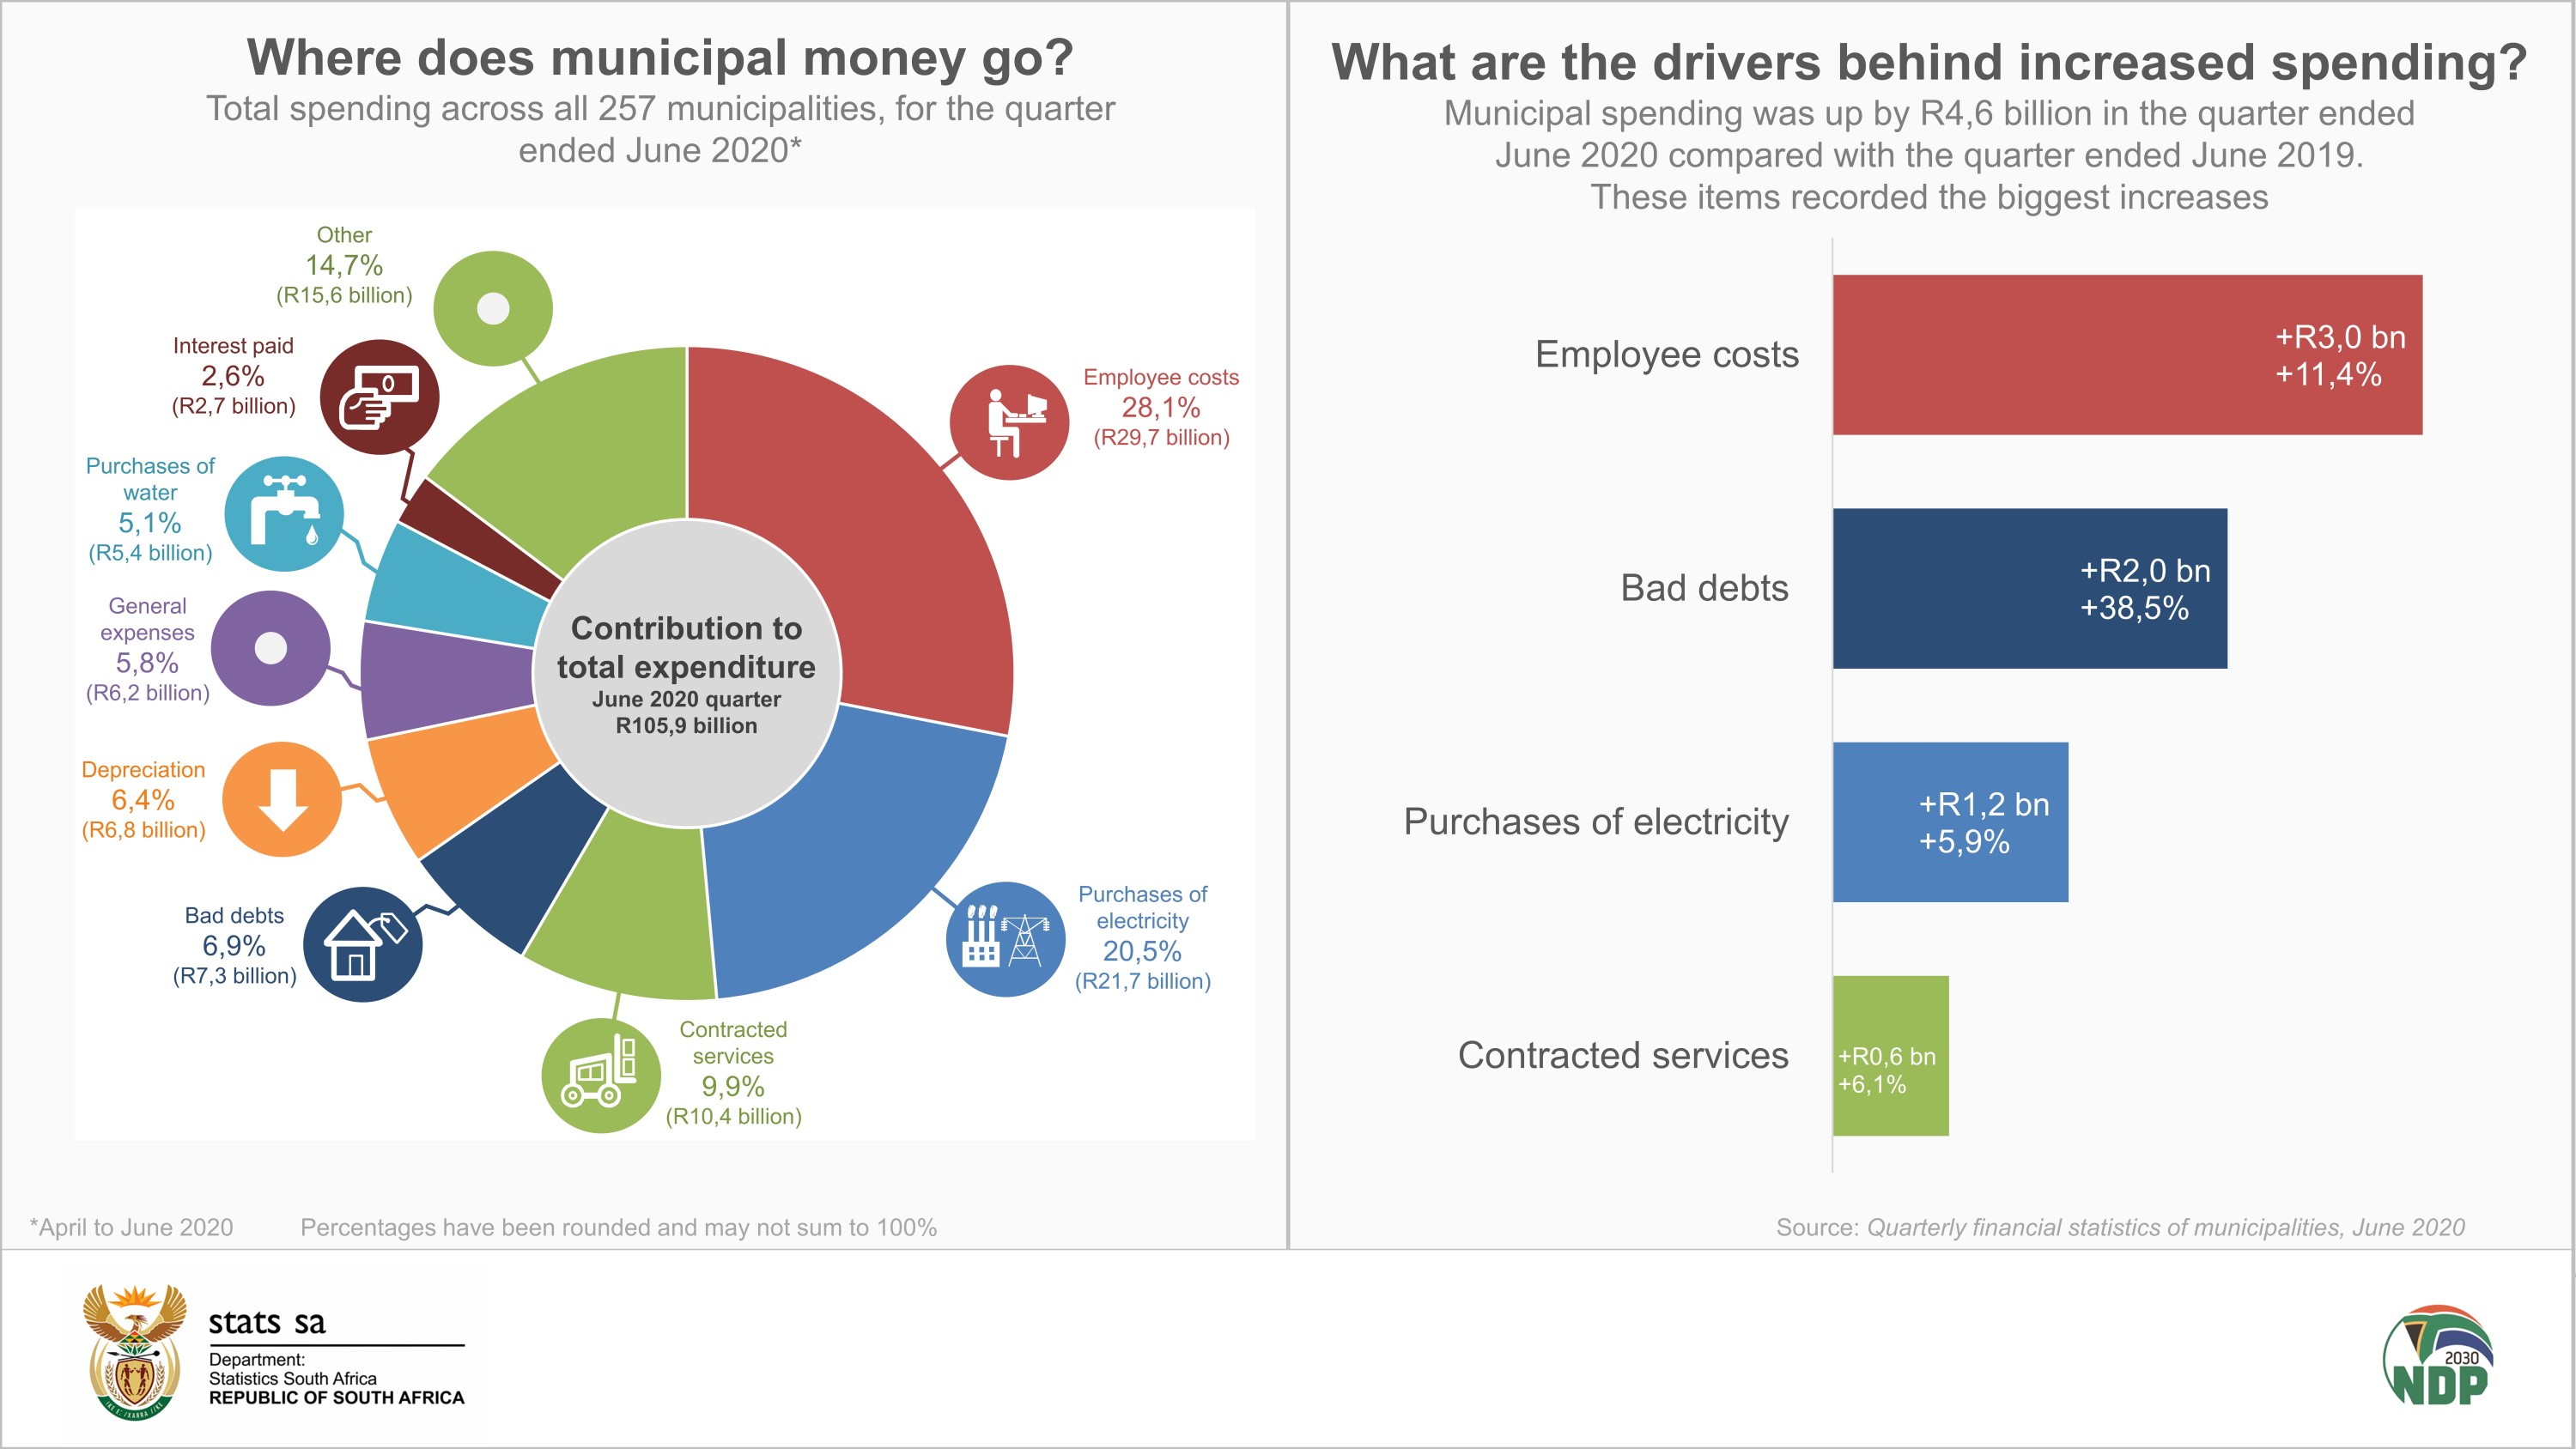
The eight metropolitan municipalities were the biggest contributors to employee costs, accounting for 56,1% of the R29,7 billion. The 205 local municipalities contributed over a third (36,4%) and the 44 district councils 7,5%.
Purchases of electricity was the second biggest expenditure item, accounting for a fifth of total expenditure.
In terms of income, the R7,3 billion (or 7,4%) increase in the quarter ended June 2020 compared with the quarter ended June 2019 was mostly driven by increases in grants and property rates.
Grants in this case are not social grants. Rather, grants and subsidies here refer to a source of direct funding that consists mostly of financial transfers from national and provincial government to municipalities. These transfers accounted for 26,6% of total income.
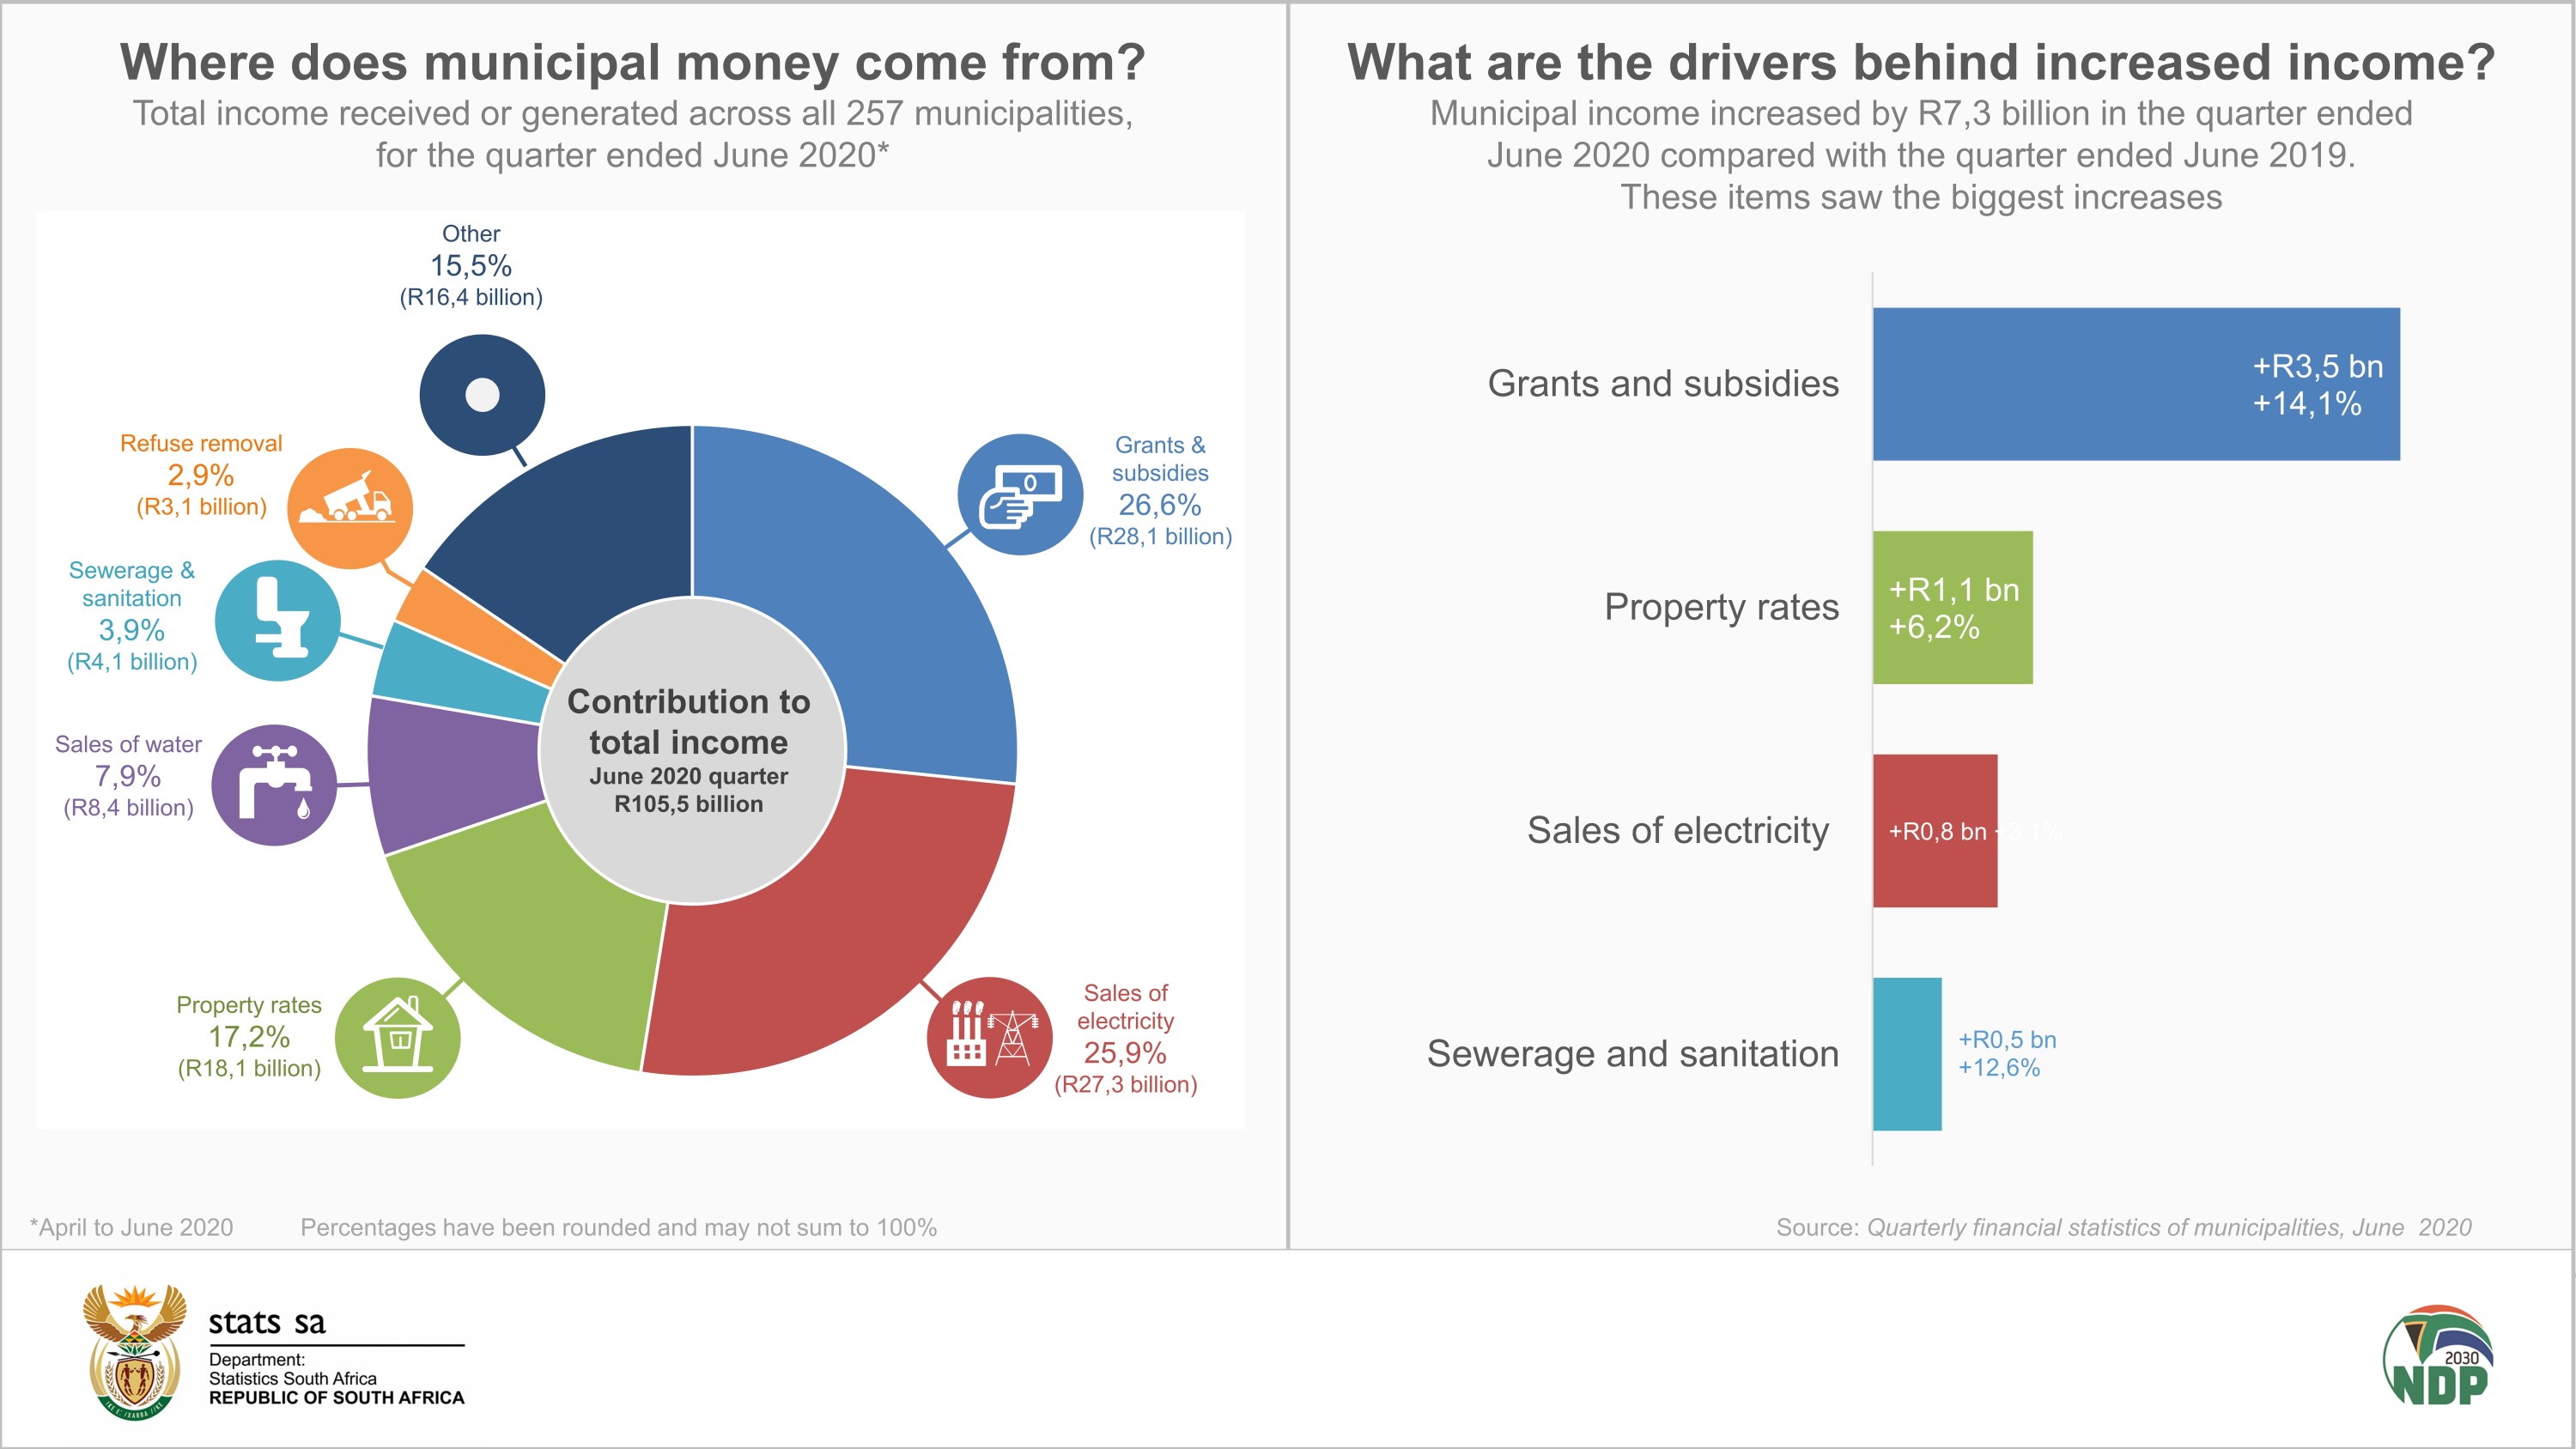
Sales of electricity increased by R822 million, accounting for just over a quarter of total income. Property rates collected by municipalities contributed 17,2% to the total income pie.
For more information, download the latest Quarterly financial statistics of municipalities statistical release here. With effect from the September 2020 quarter, Stats SA will reduce the scope of this publication from 257 municipalities to the 130 largest municipalities. For further information regarding this change, please contact Malibongwe Mhemhe at (012) 310 6928 or MalibogweM@statssa.gov.za.
1 Total expenditure excludes capital expenditure.
2 Expenditure figures appear in Table 1 and income figures in Table 2 of the report.
Similar articles are available on the Stats SA website and can be accessed here.
For a monthly overview of economic indicators and infographics, catch the latest edition of the Stats Biz newsletter here.