
Public-sector infrastructure investment falls for a third year
The economic downturn and reduced levels of government infrastructure investment have taken a heavy economic toll on capital spending by the public sector.
Public-sector spending on infrastructure (referred to as capital expenditure) decreased for a third consecutive year, falling from R250 billion in 2018 to R231 billion in 2019 according to Stats SA’s latest Capital expenditure by the public sector report. This represents a decline of 7,6%.
The 747 institutions that form the public sector spent less on plant, machinery and equipment (down R18,5 billion) and new construction works (down R3,1 billion). There was an increase in spending of R2,5 billion in transport equipment, land and existing buildings, leased assets and investment property, and ‘other’ fixed assets.
The public sector includes national government and provincial government departments, municipalities, public corporations, higher education institutions and extra-budgetary accounts and funds (EBAs).
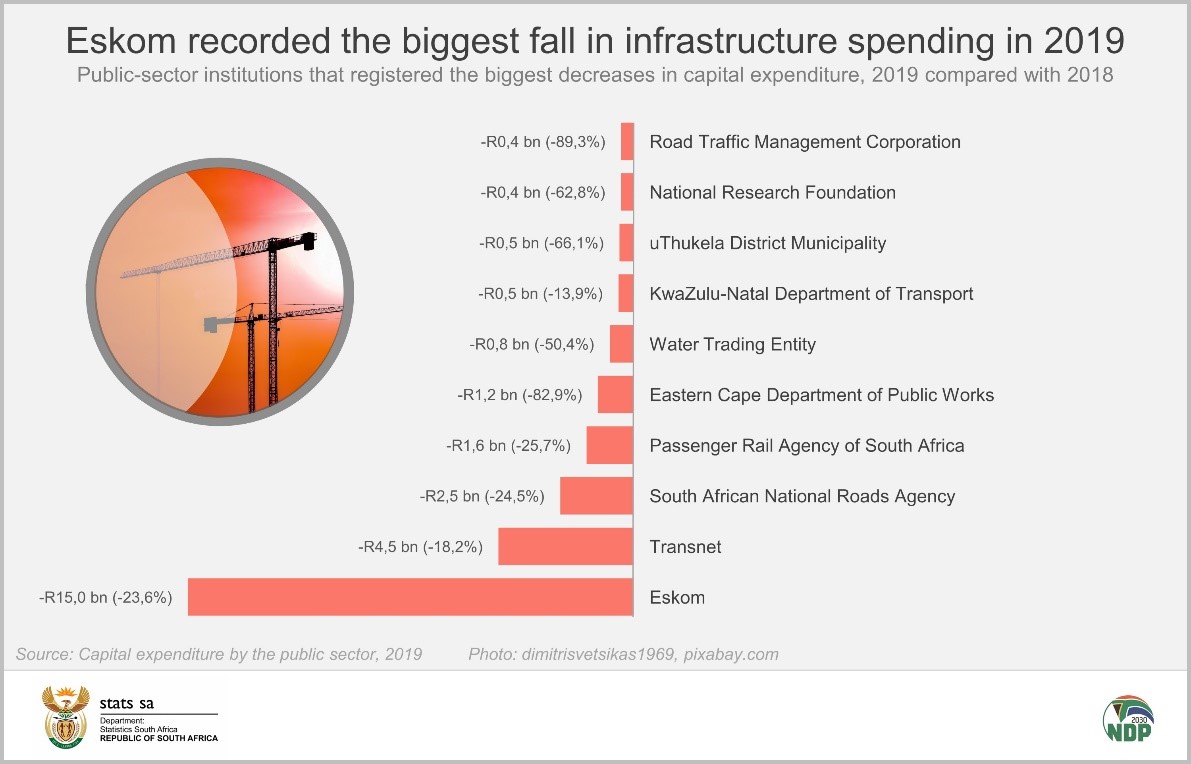
Eskom was the major contributor to the overall decline in 2019, cutting its own spending on infrastructure by R15,0 billion. The fall was due to budget cuts, as well as the utility finalising a number of its larger projects. Eskom reduced spending across all capital expenditure types, with the exception of leased assets, which recorded no change.
Despite this decline, Eskom remains the biggest spender on infrastructure in the public sector. As the nation’s dominant power producer, the utility was responsible for 21% (or R48,3 billion) of total public-sector capital expenditure in 2019.
Transnet recorded the second biggest fall, registering a decrease of R4,5 billion. The utility cut back on plant, machinery and equipment by R18,7 billion. However, there was a notable increase (of R13,5 billion) in spending on new construction works as the company focussed on maintaining its rail and ports divisions.
The South African National Roads Agency (SANRAL) was the third biggest negative contributor, registering a decline of R2,5 billion in spending as it cut back on road construction.
As a group, public corporations reduced spending by R19,6 billion (down 17,7%). The heavyweights Eskom and Transnet were the major contributors to this decline.
SANRAL, the Water Trading Entity and the National Research Foundation were the biggest drags on capital expenditure amongst EBAs, institutions that provide services to or on behalf of government. EBAs recorded a fall in capital expenditure of R4,2 billion in 2019 (down 17,6%).
Provincial government departments cut spending by R1,9 billion (down 5,6%). The decrease was mainly due to delays and interruptions that hampered infrastructure spending, mostly affecting the building of schools and maintenance of road infrastructure. The Eastern Cape Department of Public Works and Infrastructure recorded a fall in capital expenditure of R1,2 billion in 2019 as it scaled back on road construction. Stats SA recently published an article covering the provincial government figures in more detail here.
On the upside, local government reported an increase of R4,8 billion in capital expenditure (up 8,0%). As a group, South Africa’s 257 municipalities invested R64,0 billion in infrastructure in 2019, the second largest amount after public corporations.
Higher education institutions recorded an increase in capital expenditure of R0,8 billion. Stellenbosch University was a major contributor to this rise, spending R1 billion on the construction of the Biomedical Research Institute (BMRI).
National government registered a rise of R1,2 billion. The National Department of Defence increased capital expenditure by R1,6 billion.
Government’s Economic Reconstruction and Recovery Plan, announced by the president earlier this month, includes infrastructure development as one of its precepts. How much will that initiative affect capital expenditure in the public sector? Stats SA will be there to report on the figures.
For more information, download the Capital expenditure by the public sector, 2019 report and unit data here.
Similar articles are available on the Stats SA website and can be accessed here.
For a monthly overview of economic indicators and infographics, catch the latest edition of the Stats Biz newsletter here.