
Universities depend more on government for funding
It has been five years since the #FeesMustFall campaign. Stats SA takes a look at where higher education institutions get their money from, and how these revenue streams have shifted since 2015.
The #FeesMustFall campaign began in October 2015 when thousands of students took to campuses across the country to protest rising tuition fees. The movement highlighted students’ dissatisfaction with the cost of education and access to funding.
The government responded to the protests by announcing a zero-percent change in fees for the 2016 academic year, and by implementing an expanded bursary scheme to support students from poorer backgrounds.
Government funding of tertiary education has accelerated since 2015, according to data from the latest Financial statistics of higher education institutions report.1
The chart below illustrates the amount of revenue that South Africa’s 20 universities and 6 universities of technology receive from government (in the form of grants) versus the amount generated or received from non-grant sources (such as tuition fees, donations, interest and dividends).
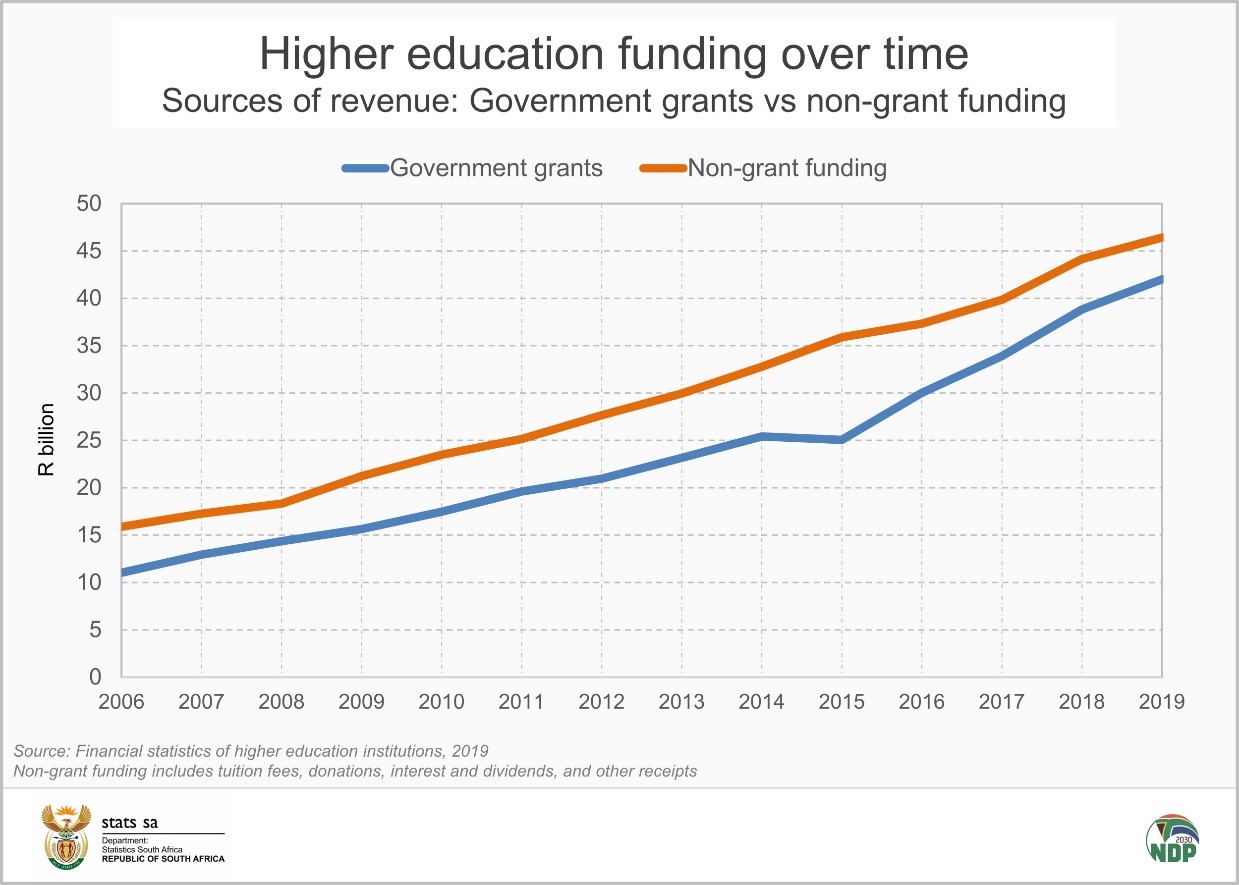
Two key points stand out from the chart.
First, higher education institutions generate or receive slightly more revenue from student fees, donations and other sources (the orange line) than they do from government grants (the blue line). In 2019, total revenue amounted to just over R88 billion, with R42 billion from government grants and R46 billion from non-grant funding.
Not to be confused with social grants, government grants are financial transfers from one state institution to another. In the case of higher education, state funding is made available via grants from the Department of Higher Education and Training (DHET).
Second, from 2008 to 2015 the gap between grant and non-grant funding widened as state funding lagged behind (notice the two lines in the chart diverging from one other). From 2015, government funding accelerated noticeably. With the slowdown in non-grant funding since 2015, the gap between the two has once again narrowed.
What about the slight drop in government funding from 2014 to 2015? This decline had nothing to do with the #FeesMustFall campaign. Rather, this anomaly was due to the University of the Witwatersrand later reclassifying revenue items in its financial statements.2
A proportional breakdown of the data also reflects the general shift over time. For every R100 of revenue generated or received in 2014 ‒ the year before the #FeesMustFall campaign began ‒ R44 was from government grants while R56 was in the form of non-grant funding (R34 from tuition fees, R7 from donations, R4 from interest and dividends, and R11 from other receipts).
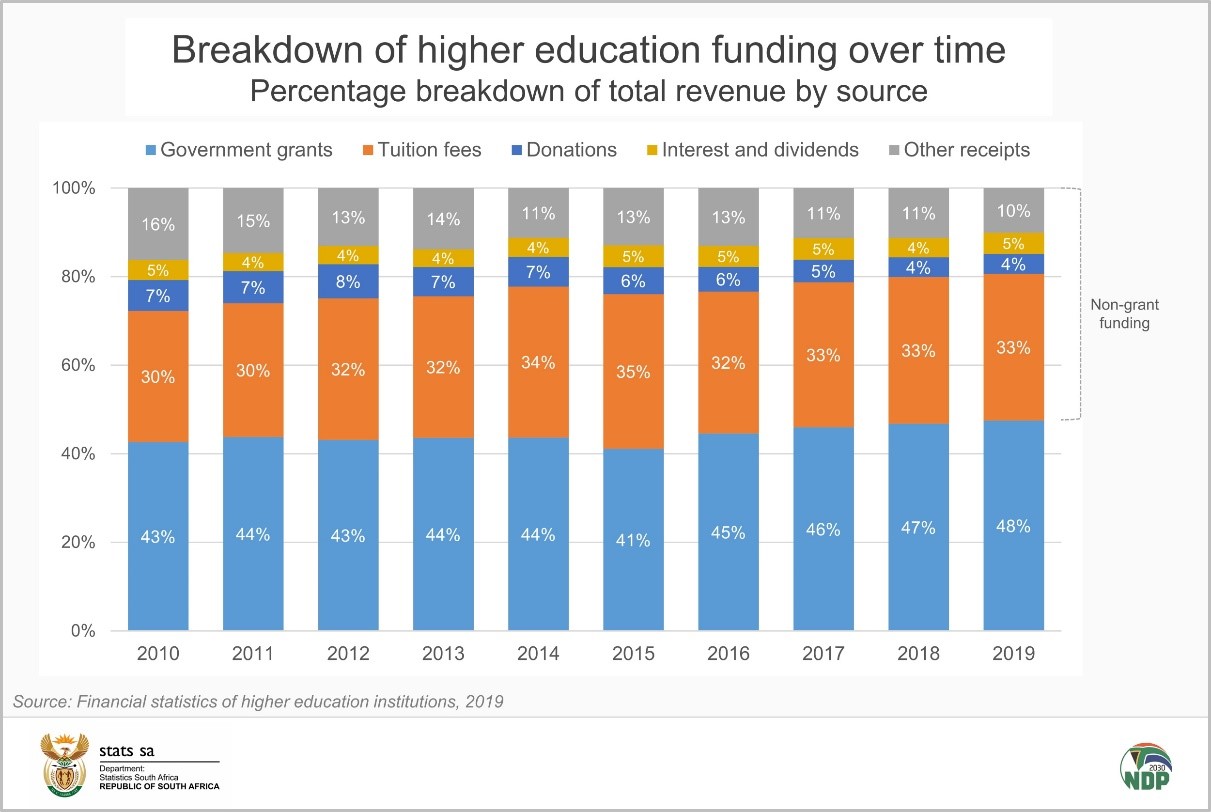
By 2019, the share from government grants had increased to R48.
Tuition fees amounted to just over R21 billion in 2015 (35% of the total), rising to just over R29 billion (33% of the total) in 2019.
The decline in government grants from 44% in 2014 to 41% in 2015 was mostly due to the reclassification of revenue items by the University of the Witwatersrand mentioned above.
How does the revenue split vary across institutions? South Africa’s universities and universities of technology are located across the country and each institution manages its own unique set of circumstances. The chart below illustrates the funding breakdown for each institution in 2019. Donations, interest and dividends, and other receipts are grouped into the category ‘other’.
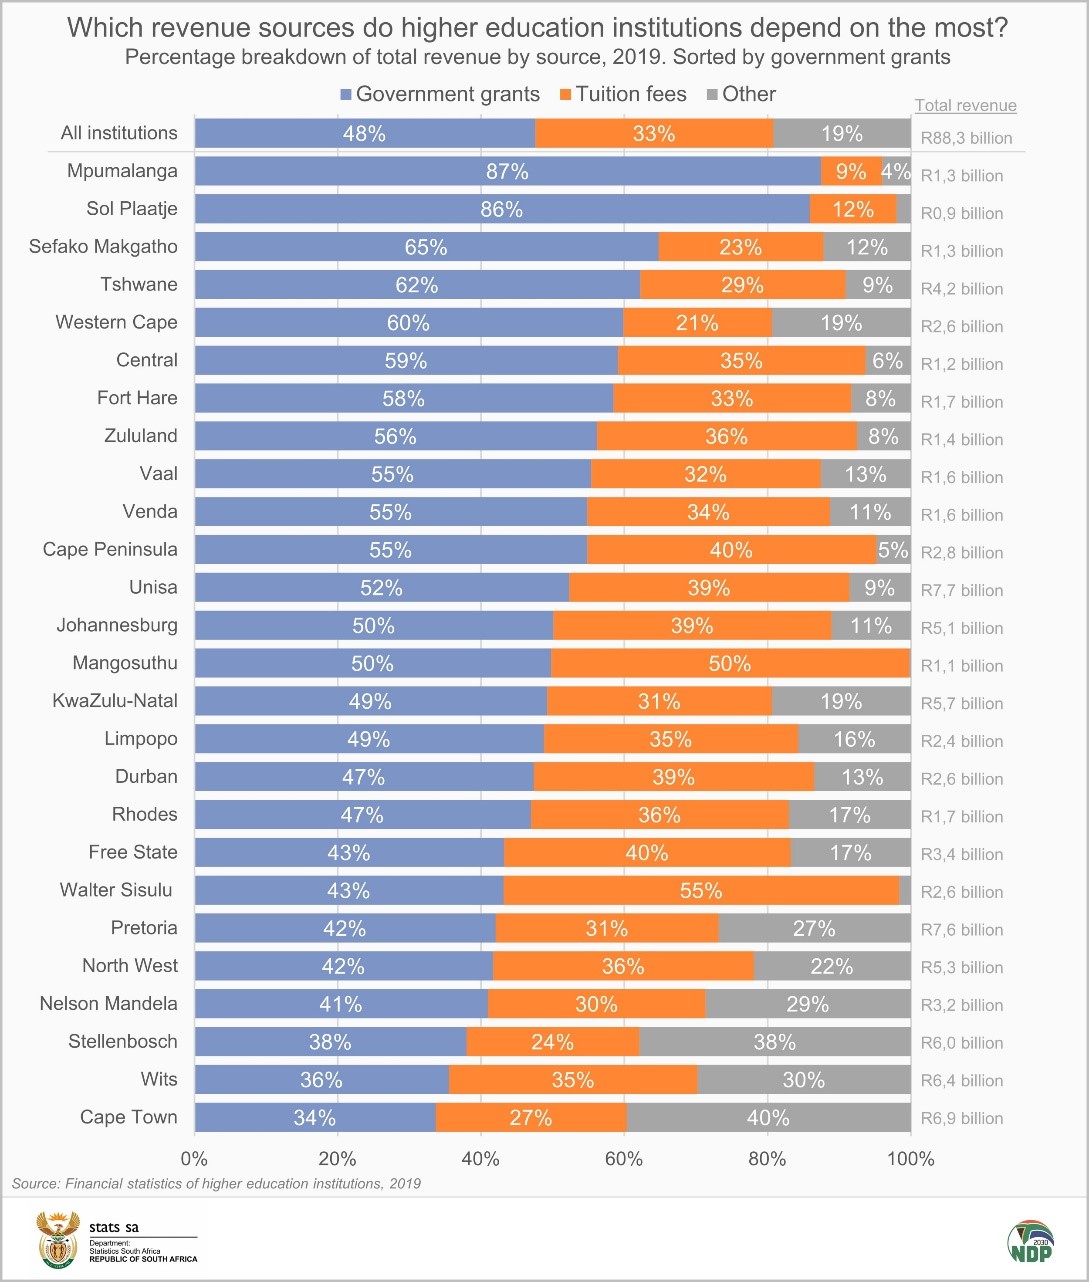
The University of Mpumalanga and Sol Plaatje University depended on government grants the most in 2019. These two institutions are relatively new. Established in 2014, they are still reliant on government for a large portion of their funding.
The University of Cape Town, the University of the Witwatersrand (Wits) and Stellenbosch University receive around a third of their revenue from government grants.
For more information, download the Financial statistics of higher education institutions release here.
1 The report is based on data that comply with Government Finance Statistics 2014 principles, presented on a cash-flow basis.
2 University of the Witwatersrand, Annual report 2016, Note 44, page 264 (available here).
Similar articles are available on the Stats SA website and can be accessed here.
For a monthly overview of economic indicators and infographics, catch the latest edition of the Stats Biz newsletter here.