
Further data shows lagging infrastructure investment
In June 2020, government announced the roll-out of an extensive infrastructure investment drive that would cover 55 projects across six sectors. The programme is an attempt to kick-start an economy battered by COVID-19, as well as to address a history of chronic infrastructure underspending.1
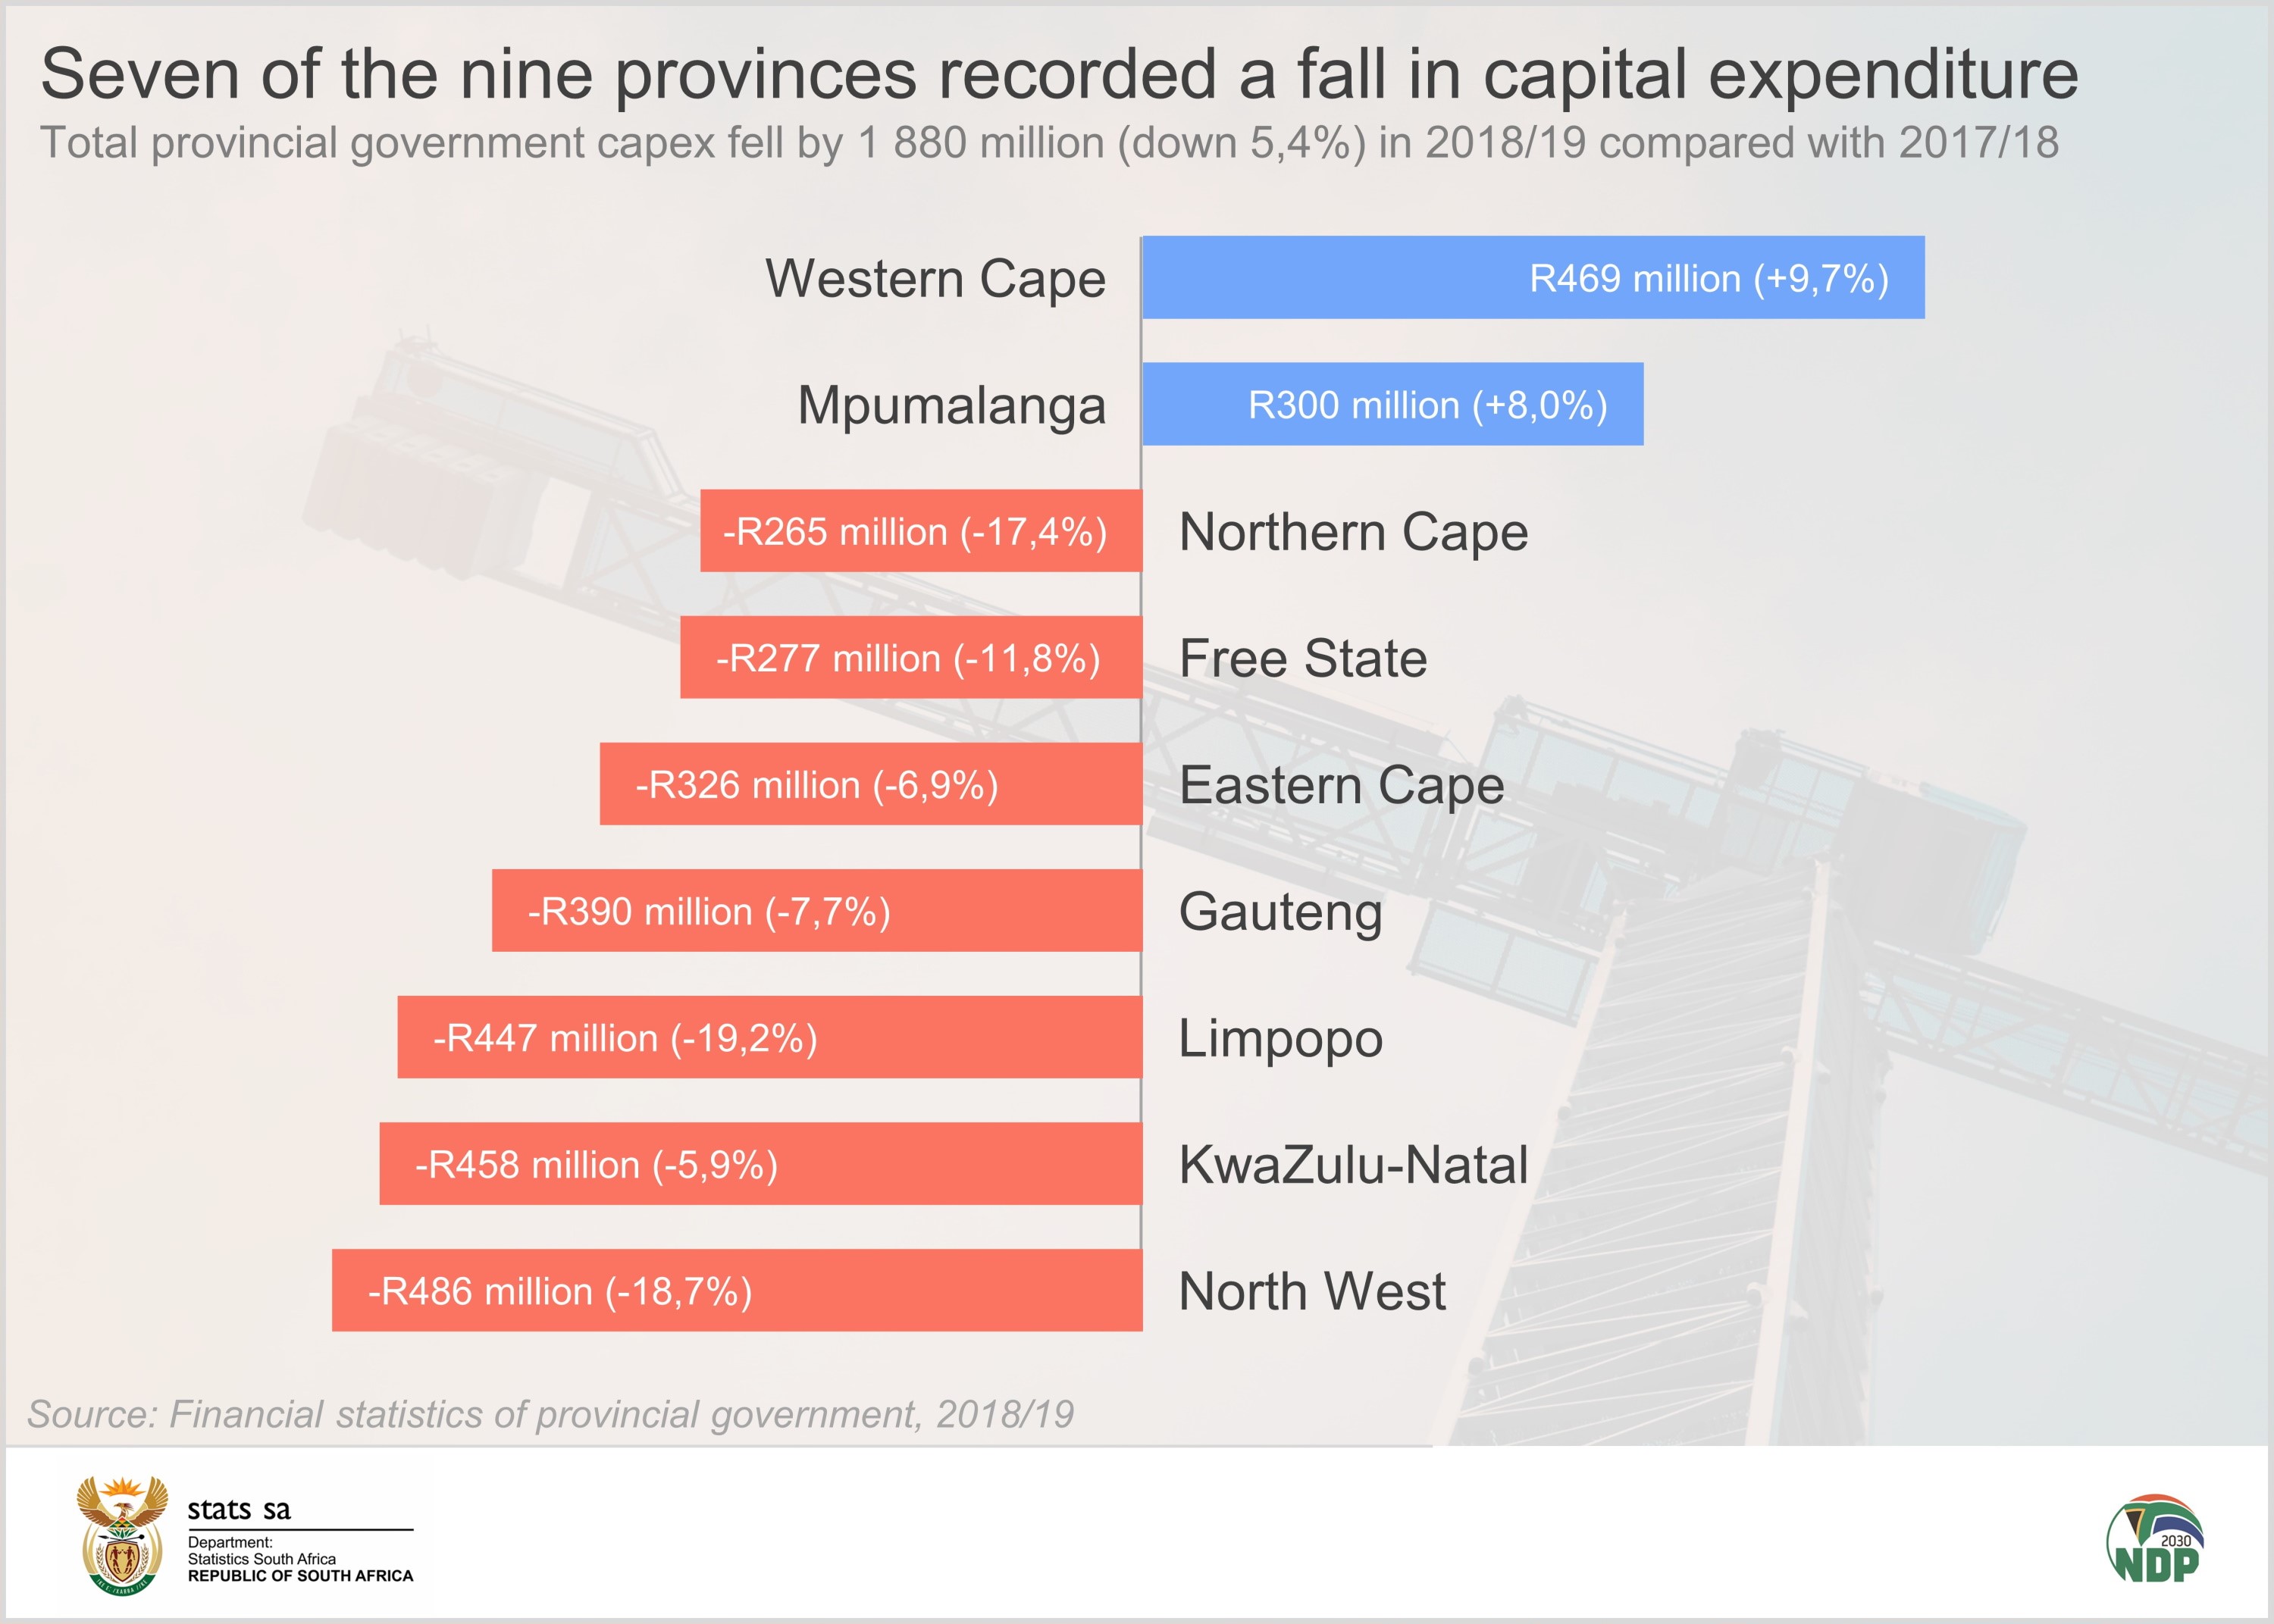
The concern over declining infrastructure investment is further confirmed by Stats SA’s most recent release of its Financial statistics of provincial government report. Delays and interruptions hampered infrastructure spending by provincial government during the 2018/19 fiscal year. This mainly affected the construction of schools, as well as the rehabilitation and maintenance of road infrastructure.
South Africa’s 123 provincial government departments recorded a decrease in infrastructure spending (referred to as capital expenditure) of R1,88 billion in 2018/19. This represents a fall of 5,4% compared with 2017/18.
Capital expenditure is money that institutions spend to buy, upgrade and maintain fixed assets such as buildings, vehicles, equipment, and land.
North West, KwaZulu-Natal, Limpopo and Gauteng recorded the biggest decreases.
North West provincial government recorded a fall of R486 million in capital expenditure. The North West Department of Education was the most significant contributor to this decrease, recording a cut of R398 million on the construction of school buildings and other fixed structures.
The slow implementation of projects in North West was the reason behind the fall in spending, according to the department’s annual report.2
KwaZulu-Natal’s decline was mainly due to underspending on road infrastructure. The provincial Department of Transport was the main contributor to the R458 million fall, decreasing its own capital spending by R387 million.
The transport department stated in its annual report that this was due to a number of reasons, including a delay in finalising the department’s participation in a road contract based in eThekwini. There was also a setback in the awarding of a large road rehabilitation tender. The department was flooded with a high volume of bids for the tender, slowing down the evaluation process and resulting in payment delays.3
Limpopo provincial government recorded a decline of R447 million, largely the result of the provincial Department of Education spending less on infrastructure projects. There were delays in the construction and completion of new schools, according to the department’s annual report. Various projects were also reprioritised, causing delays in the allocation of new maintenance and service delivery work to contractors.4
The decline in capital expenditure in Gauteng was also driven largely by a fall in education spending. The province recorded a decline in the construction of new school buildings and renovations. The provincial Department of Education stated in its annual report that the underspending was caused by underperforming contractors, community disruptions, bad weather conditions and delays brought on by service providers.5
Provincial government is not the only sector that has cut back on capital expenditure. Data covering the entire public sector shows an 8,2% fall in infrastructure investment in 2018. This was on the back of a 4,0% decline in 2017. With these decreases, public-sector capital spending slipped to a level last seen in 2014.6
The general fall in infrastructure investment mirrors the long-term stagnation in the construction industry. Construction experienced its eighth consecutive quarter of economic decline in the second quarter of 2020, according to the latest gross domestic product (GDP) figures.7
Infrastructure development is important. Economic infrastructure (e.g. electricity and water supply, transport, communications) and social infrastructure (e.g. schools, universities, hospitals) provide a foundation for economic and social activity. Infrastructure development is one of many dimensions to achieving sustainable growth in GDP and, accordingly, expanding the labour market; provided that it’s directed towards areas of greatest need. The statistics on infrastructure investment will continue to attract much interest and attention.
For more information, download the Financial statistics of provincial government 2018/2019 report here. Stats SA publishes detailed reports on the financial status of all spheres of government, including national government, provincial government, local government, extra-budgetary accounts and higher education institutions. A consolidated report, containing financial data for all spheres for the 2018/19 fiscal year, is scheduled to be published before the end of the year.
1 Infrastructure Development Act – Strategic Integrated Projects (available here).
2 North West Department of Education and Sport Development, Annual Report 2018/19 (available here).
3 KwaZulu-Natal Department of Transport, Annual Report 2018/19 (available here).
4 Limpopo Department of Education, Annual Report 2018/19 (available here).
5 Gauteng Department of Education, Annual Report 2018/19 (available here).
6 Stats SA, Public-sector capital expenditure continues to fall (read here).
7 Stats SA, Steep slump in GDP as COVID-19 takes its toll on the economy (read here).
Similar articles are available on the Stats SA website and can be accessed here.
For a monthly overview of economic indicators and infographics, catch the latest edition of the Stats Biz newsletter here.