
Baking bad during lockdown
You’ve waited too long. Your friends have tried it, you’ve seen the videos, you’re feeling the FOMO. You roll up your sleeves – it is time to bake your own lockdown bread.
The kitchen is ready. The ingredients are all set out. Two cups of boiling water – check! Instant yeast, brown sugar, salt, flour and canola oil. Everything is there.
You add the water and yeast into a bowl. You stir the mixture and contemplate how much the ingredients cost you. They sure have risen in price, you think to yourself.
Enter the statistician.
The actual price data are a bit more … complicated. Prices for one of the five ingredients fell during the first three months of lockdown, according to inflation data from Stats SA. Brown sugar was on average 3,6% cheaper in June compared with March.
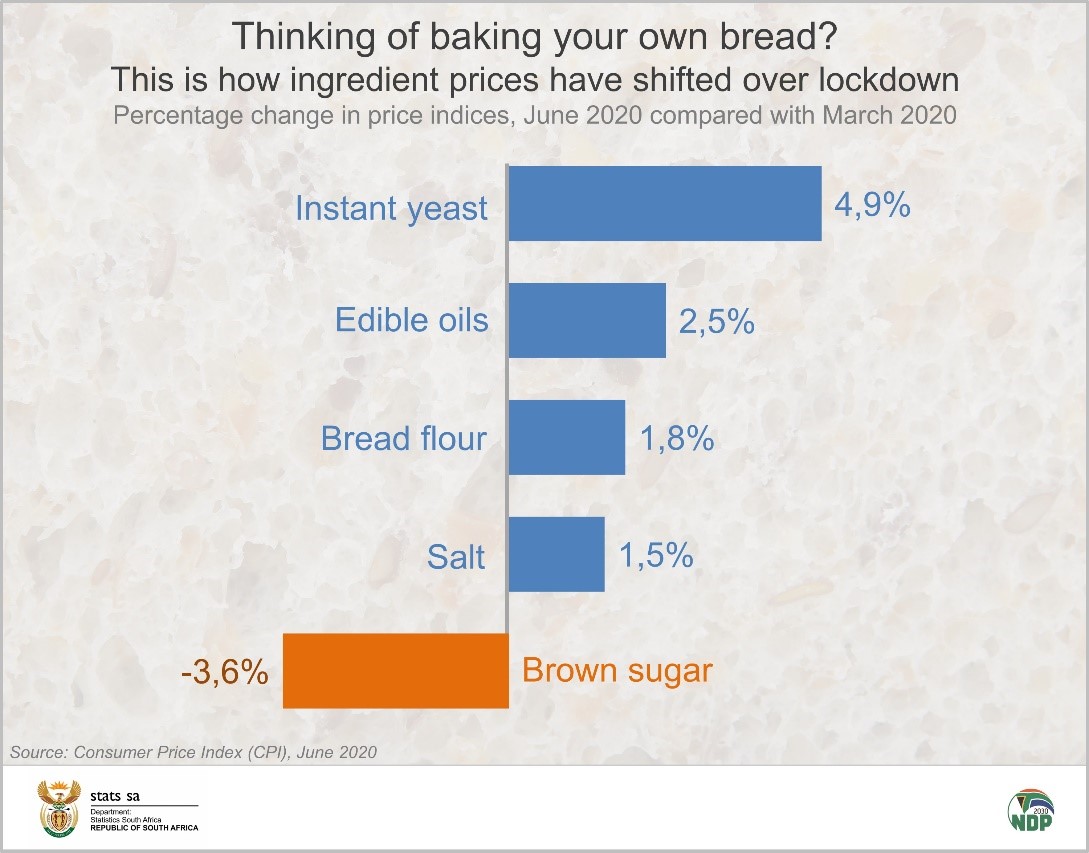
Your eye wanders to the open packet of yeast on the counter. Instant yeast prices jumped by 4,9% over the same period.
You add the sugar to the mixture. Among your list of ingredients, sugar is the most popular. White and brown sugar together contribute 42c for every R100 of South African household spending.1 White sugar is the most popular of the two, accounting for 32c. Edible oils contribute 25c while instant yeast, bread flour and salt each contribute 3c.
The salt and flour are up next. You throw these into the bowl. This time with a bit of flair as you are beginning to really enjoy yourself.
Salt has become more expensive over the long term. Its price index has climbed by 34,7% since January 2017, the month Stats SA started publishing data with the new inflation basket. The average price for a 500 g packet of salt that month was R8,26. In June 2020, it was R13,59.
Instant yeast was a close second, rising (see what we did there?) by 34,4%. A 10 g sachet would have set you back R3,74 in January 2017, increasing to R5,24 in June 2020. Price indices for salt and instant yeast increased faster than the index recorded for food and non-alcoholic beverages.
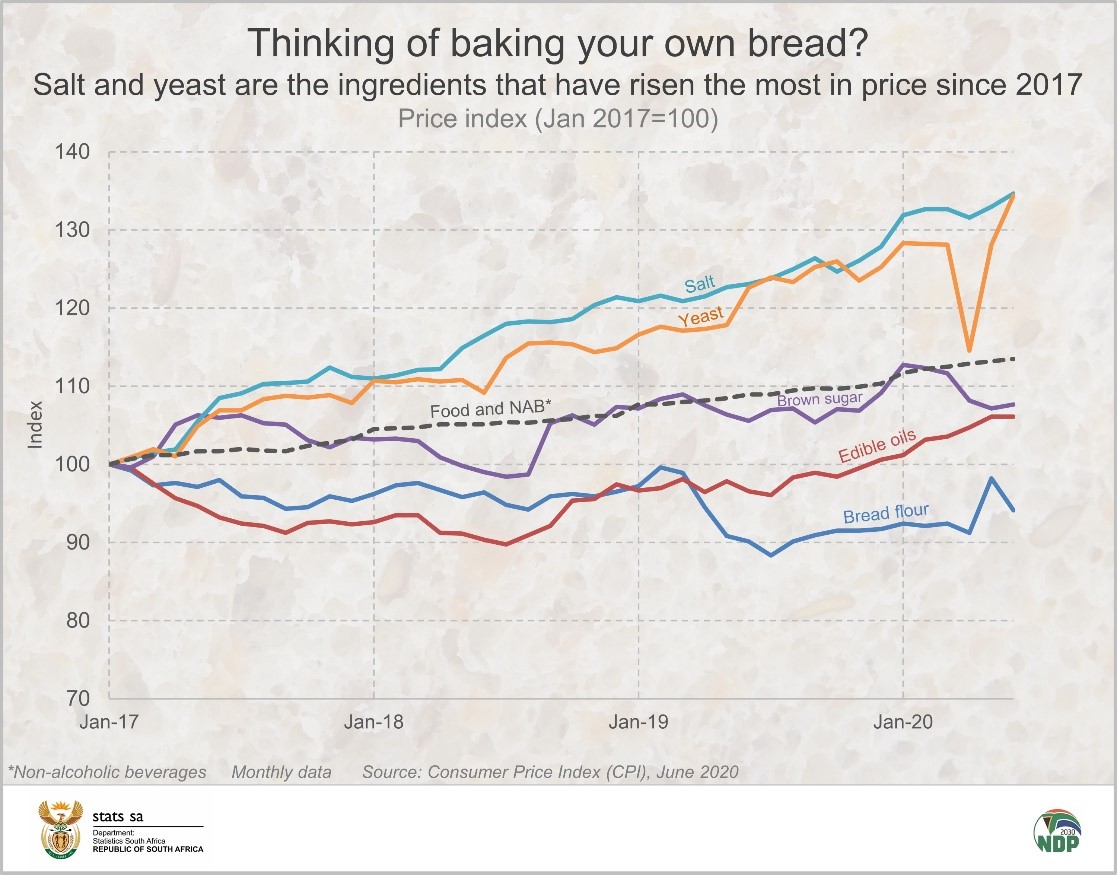
On the other side of the coin, bread flour prices dropped by 5,9% over the same period.
The oil is the last item on the list. You add this to the mixture and stir until a dough starts to form. You complete the rest of the steps: transferring the dough to a clean surface; kneading the dough for about 10 minutes; placing it in a flour-dusted tray (until it doubles in size); and then straight into the oven.
As you wait the 30 minutes or so for the bread to bake, you realise how fun this has all been. You contemplate the possibility of extending your repertoire. Muffins next time, maybe? Brioche? Rainbow cake? Swiss rolls? The possibilities are endless.
You will need extra ingredients, though – that’s for sure. Eggs, margarine, milk, spices, cheese, peanuts, chocolate. Each ingredient has its own price story. Whatever baking journey you decide to take, Stats SA will be there to tell you how much more or less it will cost you.
The June 2020 Excel file with average prices for 193 consumer items is available for download here. Provincial data are available here.
A list of price indices for 216 consumer items is available here.
All these files, as well as the June 2020 Consumer Price Index (CPI) release, are available here.
1 These represent the headline (all urban) weights in the CPI basket. Source: Consumer Price Index, The South African CPI Sources and Methods Manual, Appendix 1, page 50 (available here).
Similar articles are available on the Stats SA website and can be accessed here.
For a monthly overview of economic indicators and infographics, catch the latest edition of the Stats Biz newsletter here.