
A 110-year-old trade venture
It’s fascinating to think that one of the earliest experiments in free trade happened right here in southern Africa. Exactly 110 years ago this month, the Southern Africa Customs Union (SACU) was born. We explore data showing how the region depends on the oldest surviving trading bloc in the world.
On 31 May 1910, South Africa became a Union, significantly altering the geopolitical landscape in the region. An older regional trade agreement, established in 1889, was no longer relevant. A trade reboot was needed.
So in June 1910, territories covered by the modern-day countries of Botswana, Namibia, Lesotho, Eswatini (formerly Swaziland) and South Africa came together to create SACU. Agreements underpinning the union have been rehashed a number of times since, but the basic goal of free trade has remained.
The union provides much needed income for member countries. In 2017/18, SACU transfers accounted for just over 40% of total government revenue for Eswatini1 and Lesotho2, according to their own records, and almost one-third of revenue for Botswana3 and Namibia.4
What are these transfers exactly?
Imagine a map. Any map. Now imagine two or more neighbouring countries on this map who want to grow their respective economies. One approach they can take is to work together to facilitate trade by creating a customs union or free trade area. Nations who join this exclusive club agree to remove customs duties between them. They also impose a common set of tariffs on imports from countries who fall outside the alliance.
A customs union might also create a common revenue pool. The five nations in SACU charge excise and customs duties on imports from the rest of the world, and these are transferred into a pool managed by South Africa. Funds from the pool are then redistributed back to the respective countries according to an agreed-upon formula.
Member countries contributed almost R100 billion to the SACU revenue pool in 2018/19, according to data from the South African Revenue Service (SARS).5 South Africa, with the biggest economy, contributed the most (98% of the total). Just over R91 billion flowed out of the pool to member countries in the same year, with South Africa the main beneficiary (receiving almost half of the proceeds). Botswana received 21% and Namibia 19% of the total.
Excluding South Africa, the total amount of money transferred to member countries was R48 billion in 2018/19.
This amount has fluctuated over the years, according to time-series data from Stats SA’s Financial statistics of national government release. The R48 billion is slightly down from the peak of R56 billion in 2017/18 (click on the chart to enlarge).
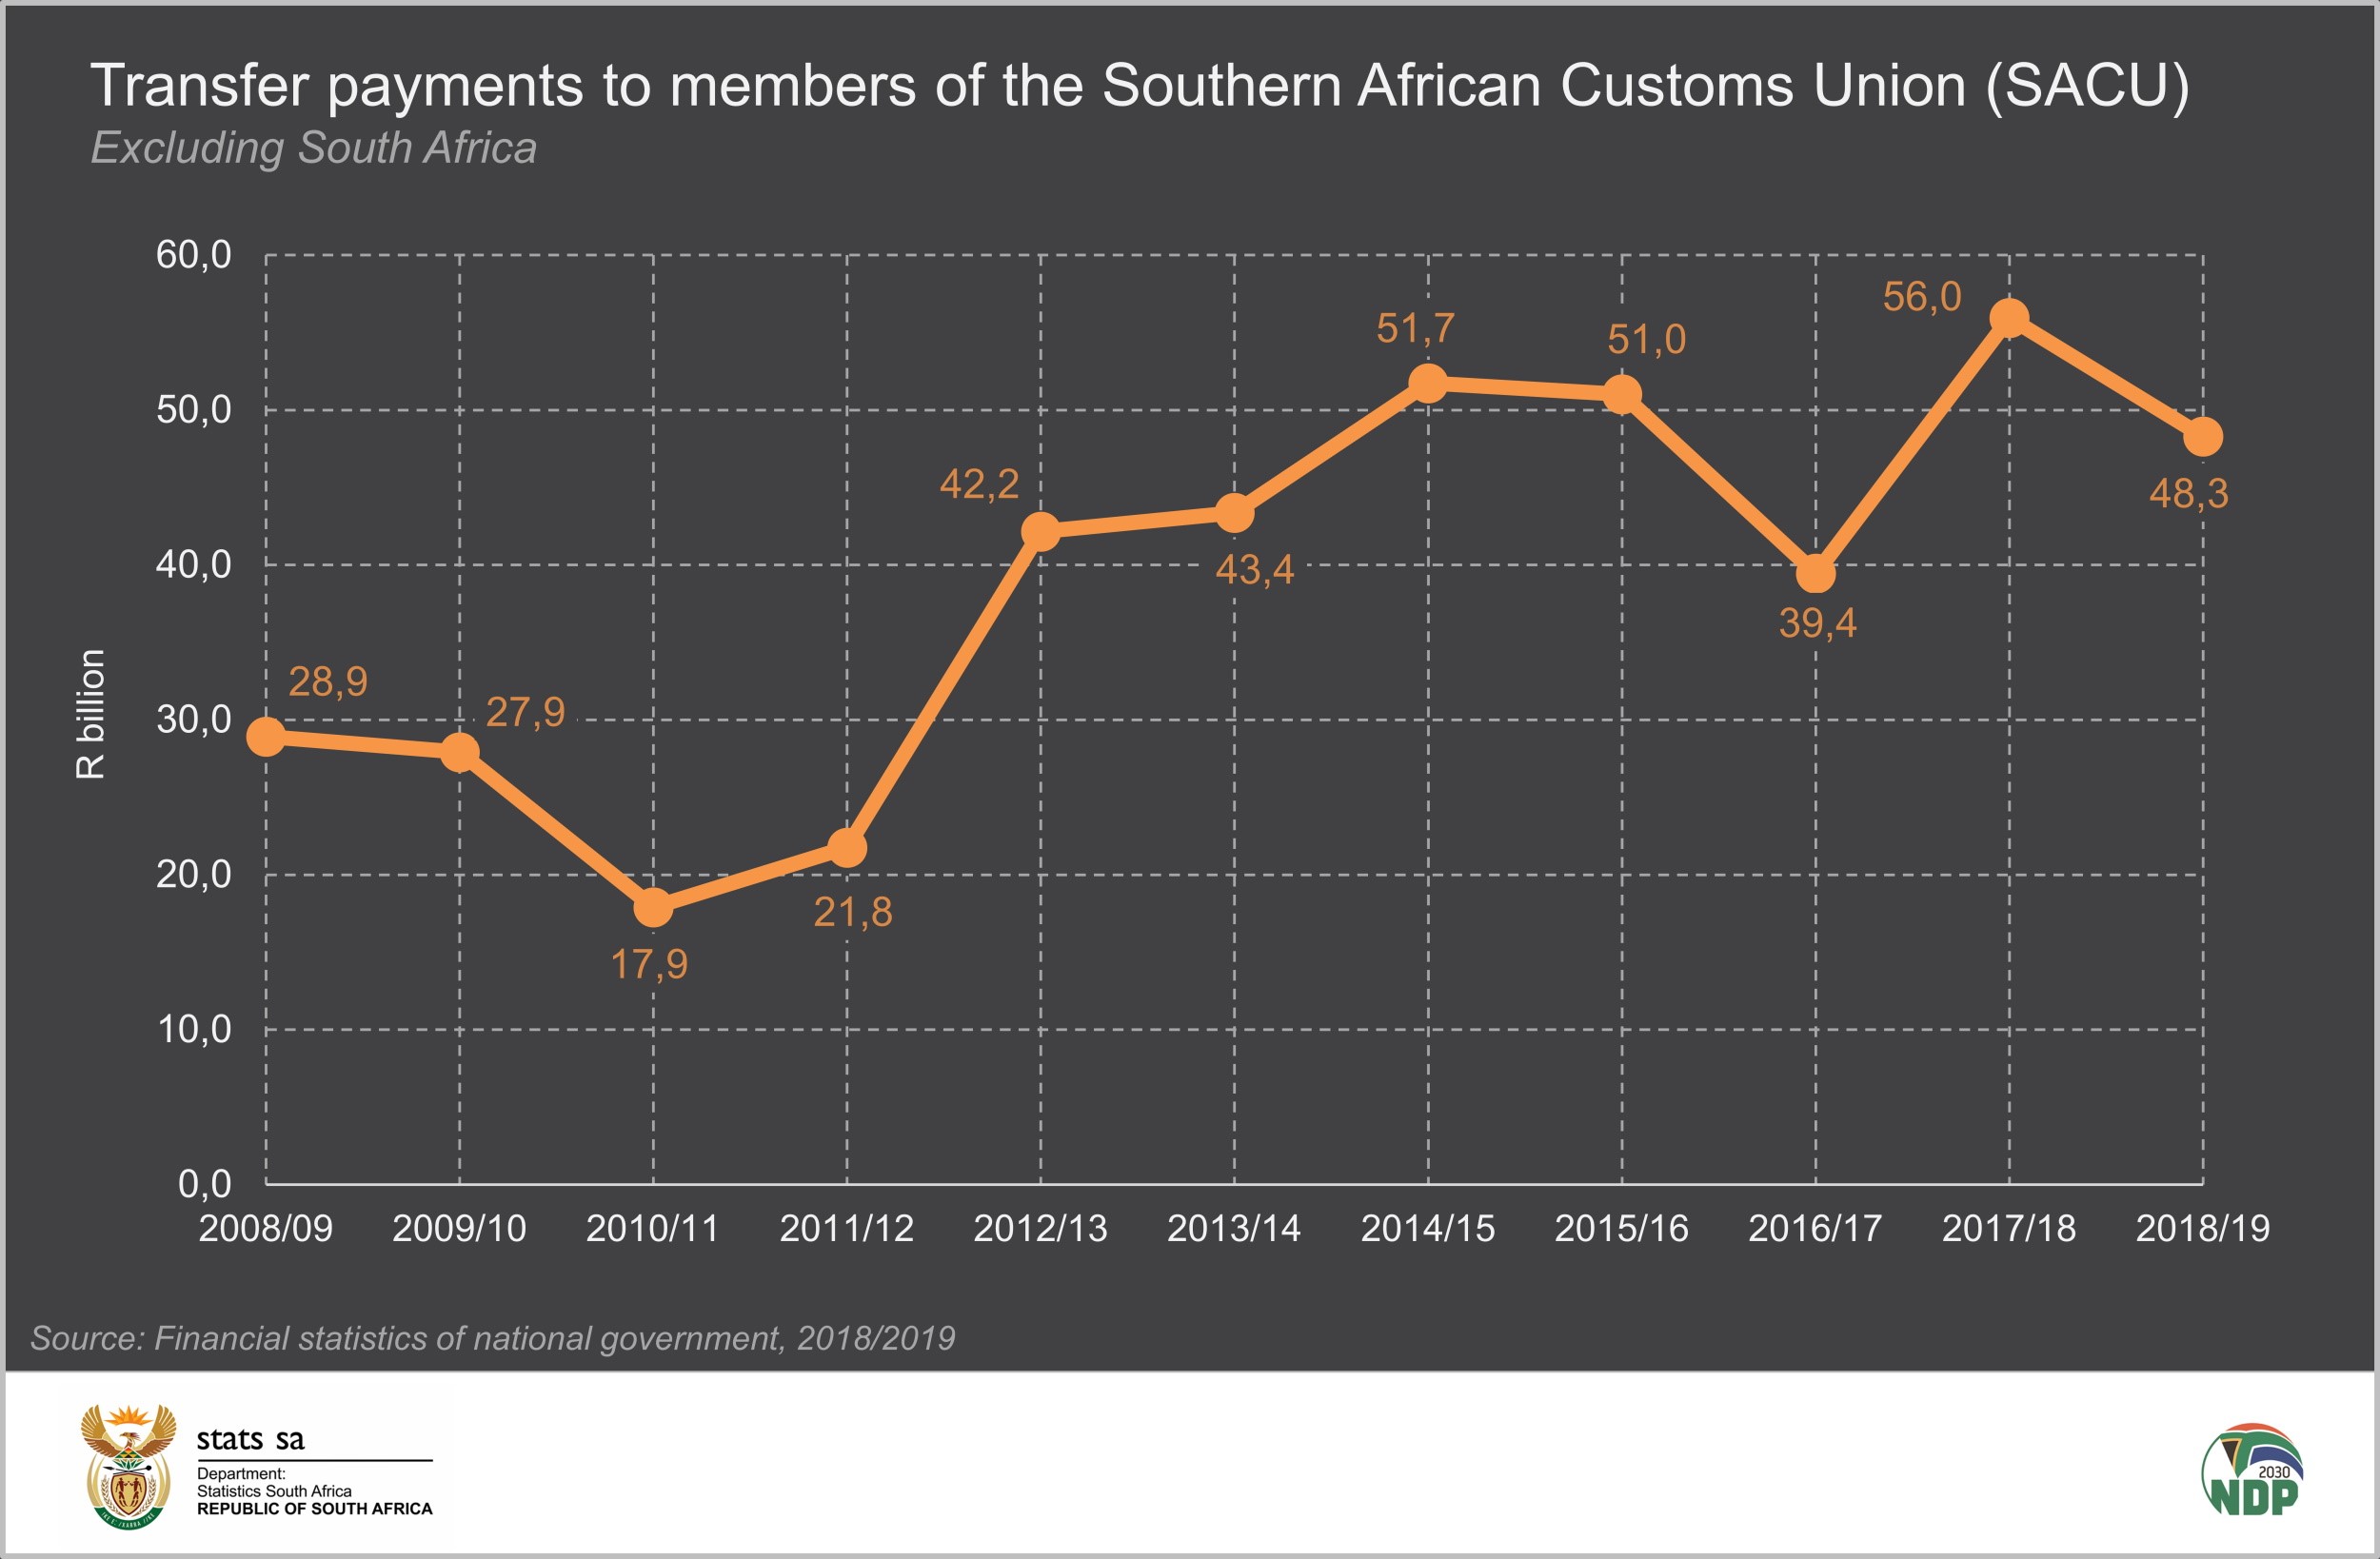
It is evident from the chart that the four countries do not receive a consistent amount every year. Many factors play a role here, but a notable one is the dominance of South Africa. The country is the biggest contributor to the pool. If the South African economy is doing well, a rise in imports translates to a rise in customs and excise duties. This bodes well for the SACU revenue stream. On the flip slide, if economic growth slows in the Union’s biggest economy, the smaller countries might be left vulnerable to lower revenue.
South Africa’s economy was already under pressure before the COVID-19 pandemic. The country entered a recession in the second half of 2019. Economic activity slowed by 1,4% in the fourth quarter, following a 0,8% slowdown in the third quarter.6 In April 2020, the first month of the national lockdown, South African mining activity saw its biggest slump in decades, according to preliminary data.7
It will take some time to assess the full economic impact of the pandemic. Stats SA is furiously working towards publishing figures for other industries. Whatever the full economic impact might be, it will mostly likely have an influence on revenue transfers within the world’s oldest trading bloc.
For more information on South African national government finances, download the latest Financial statistics of national government release here.
1 The Government of the Kingdom of Eswatini, Estimates for the years from 1st April 2019 to 31st March 2022, page 11. Available here.
2 The Kingdom of Lesotho, Budget Estimates Book for Financial Year 2019/2020, page 1. Available here.
3 Republic of Botswana, Annual Statements of Accounts (ASA) for the Financial Year Ended 31 March 2018, page 22. Available here.
4 Republic of Namibia, Mid-Year Budget Review for FY2018/2019 and Policy Statement for 2019/2020-2021/2022, Table 9. Available here.
5 South African Revenue Service (SARS), Tax Statistics, 2019, Table 6.10 and Table 6.11. Available here.
6 Stats SA, Economy slips into recession. Available here. Stats SA will be releasing GDP figures for the first quarter of 2020 (covering January to March) on 30 June 2020.
7 Stats SA, Mining: Production and sales, April 2020. Available here.
Similar articles are available on the Stats SA website and can be accessed here.
For a monthly overview of economic indicators and infographics, catch the latest edition of the Stats Biz newsletter here.