

COVID-19: Weekly deflation of essential products continues
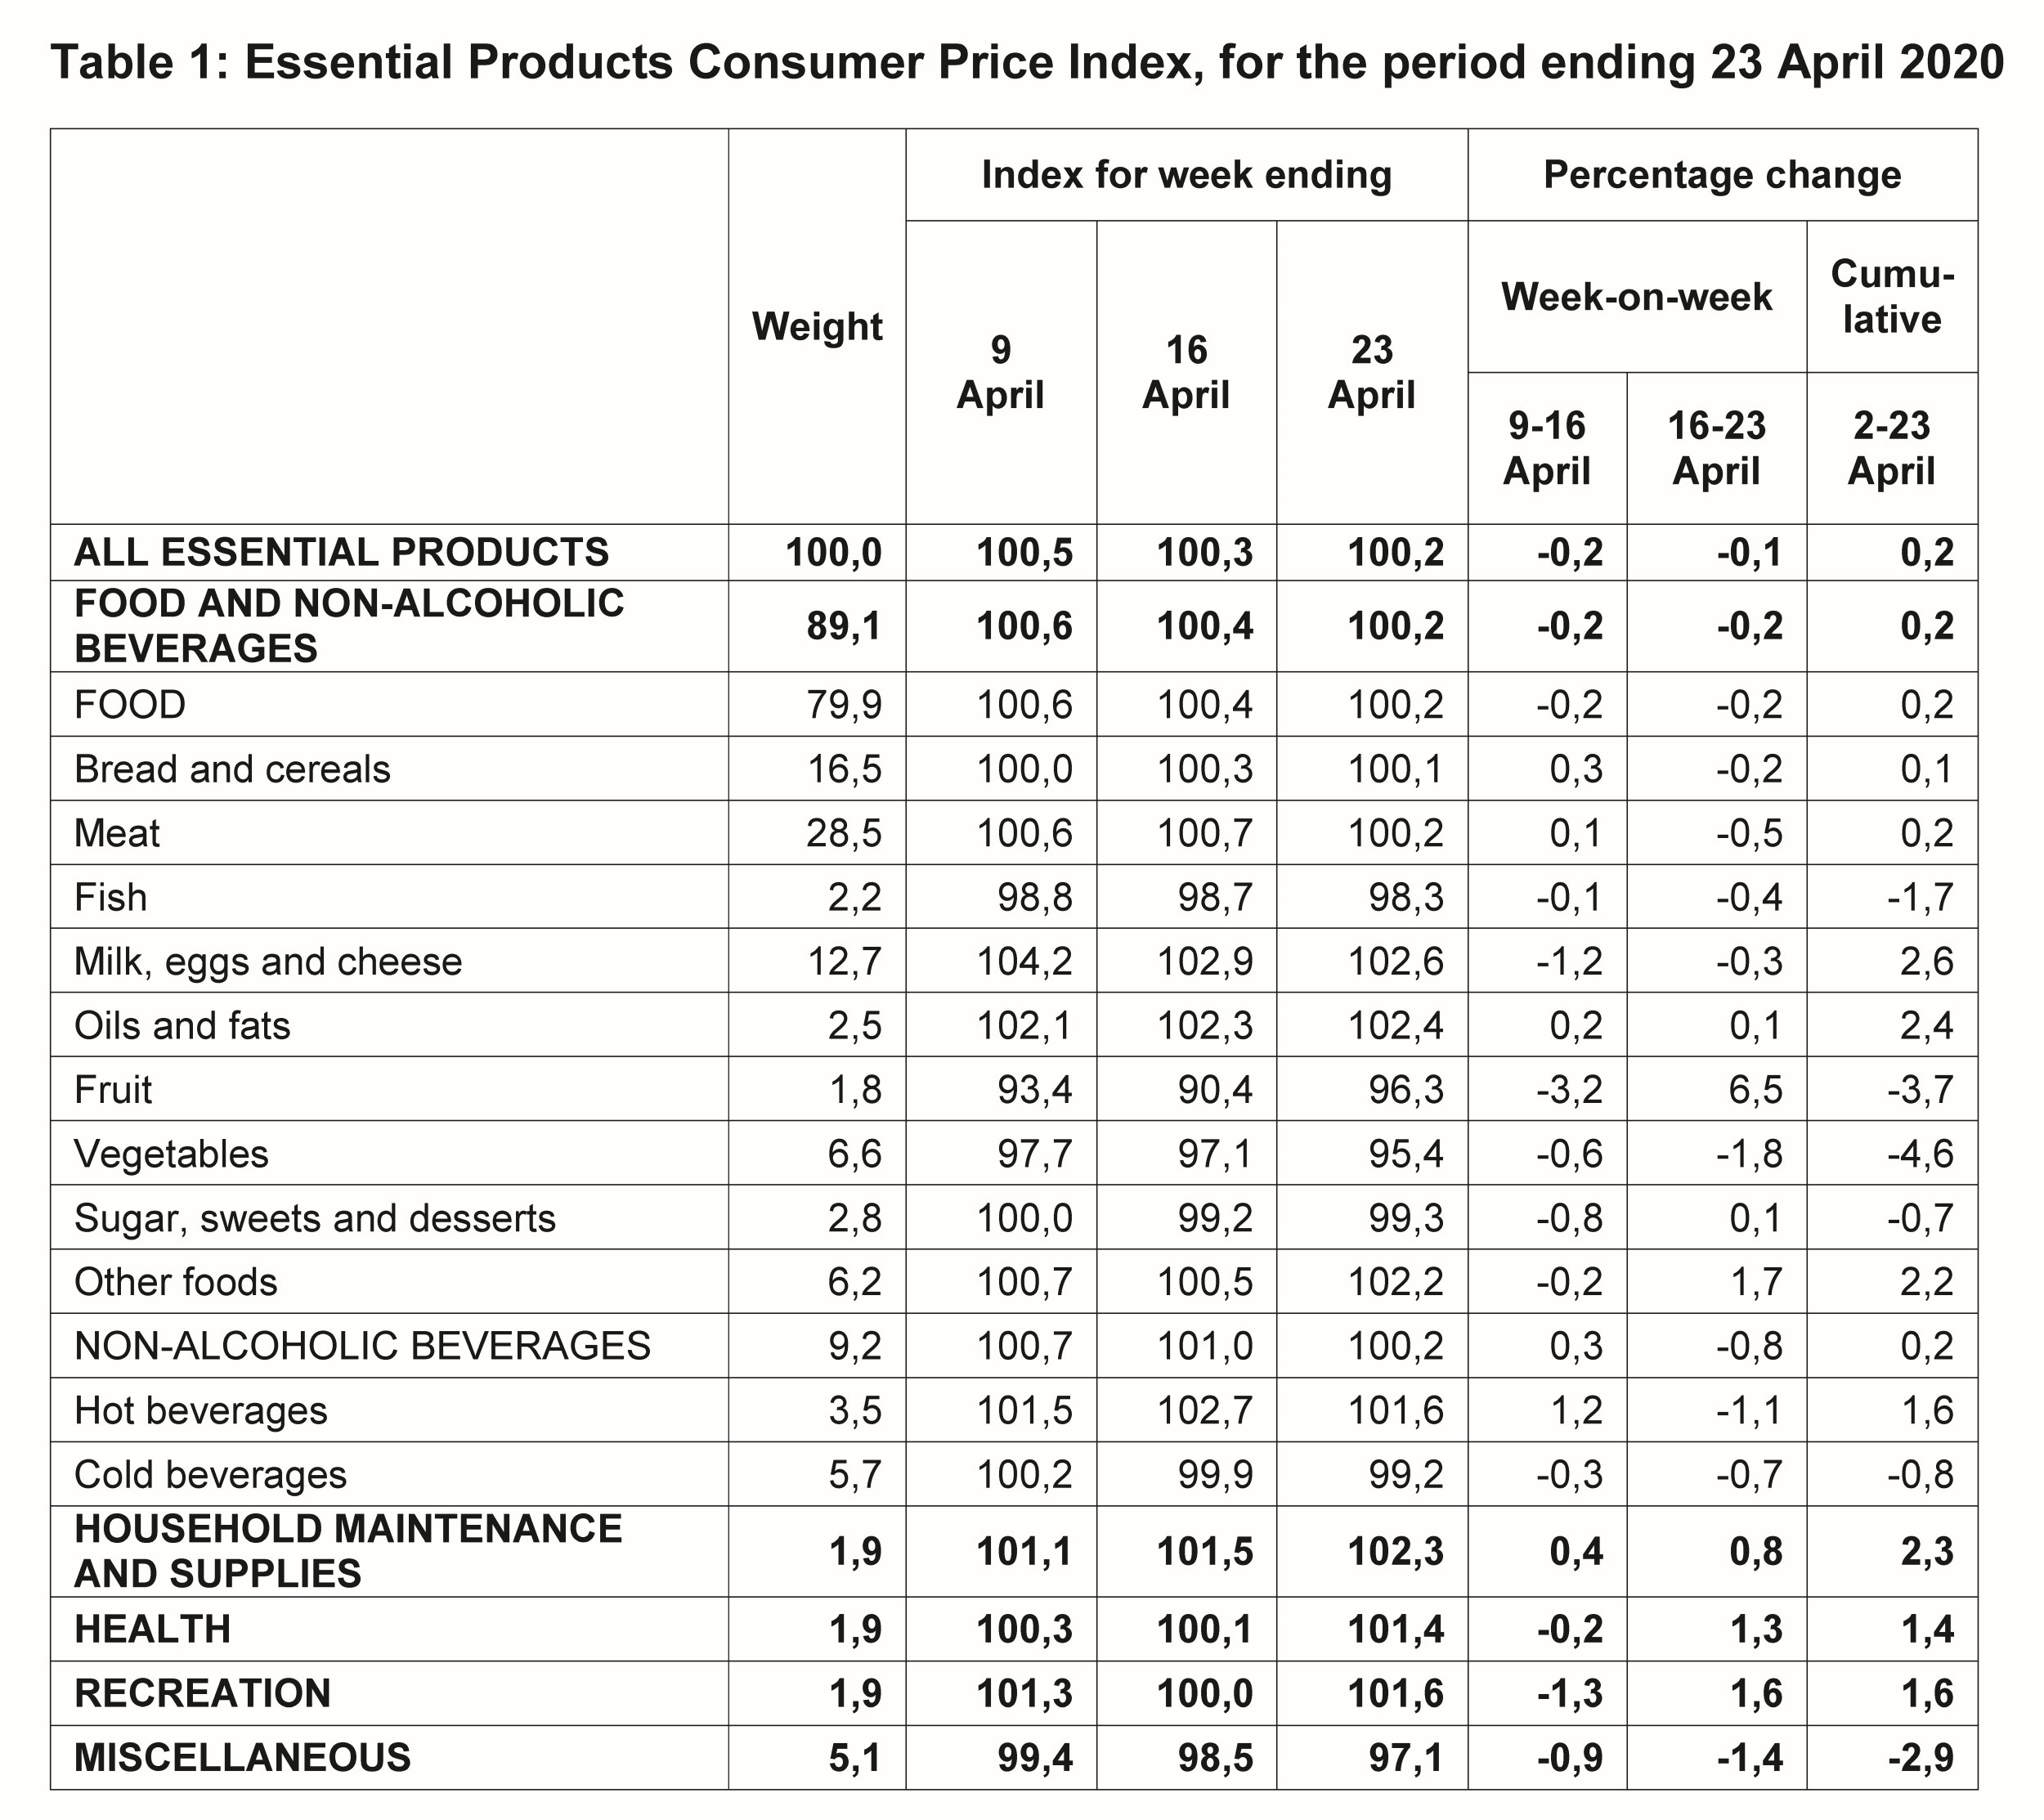
The prices of essential products decreased by 0,1% between the weeks ending 16 and 23 April after decreasing by 0,2% the previous week. The essential products consumer price index (EP–CPI) has increased by 0,2% since weekly data was first collected at the beginning of the lockdown in the week ending 2 April.
This article covers the results from the EP–CPI for the fourth week of lockdown (the week ending 23 April 2020). Results for the second and third weeks of lockdown are covered in an earlier article, available here.
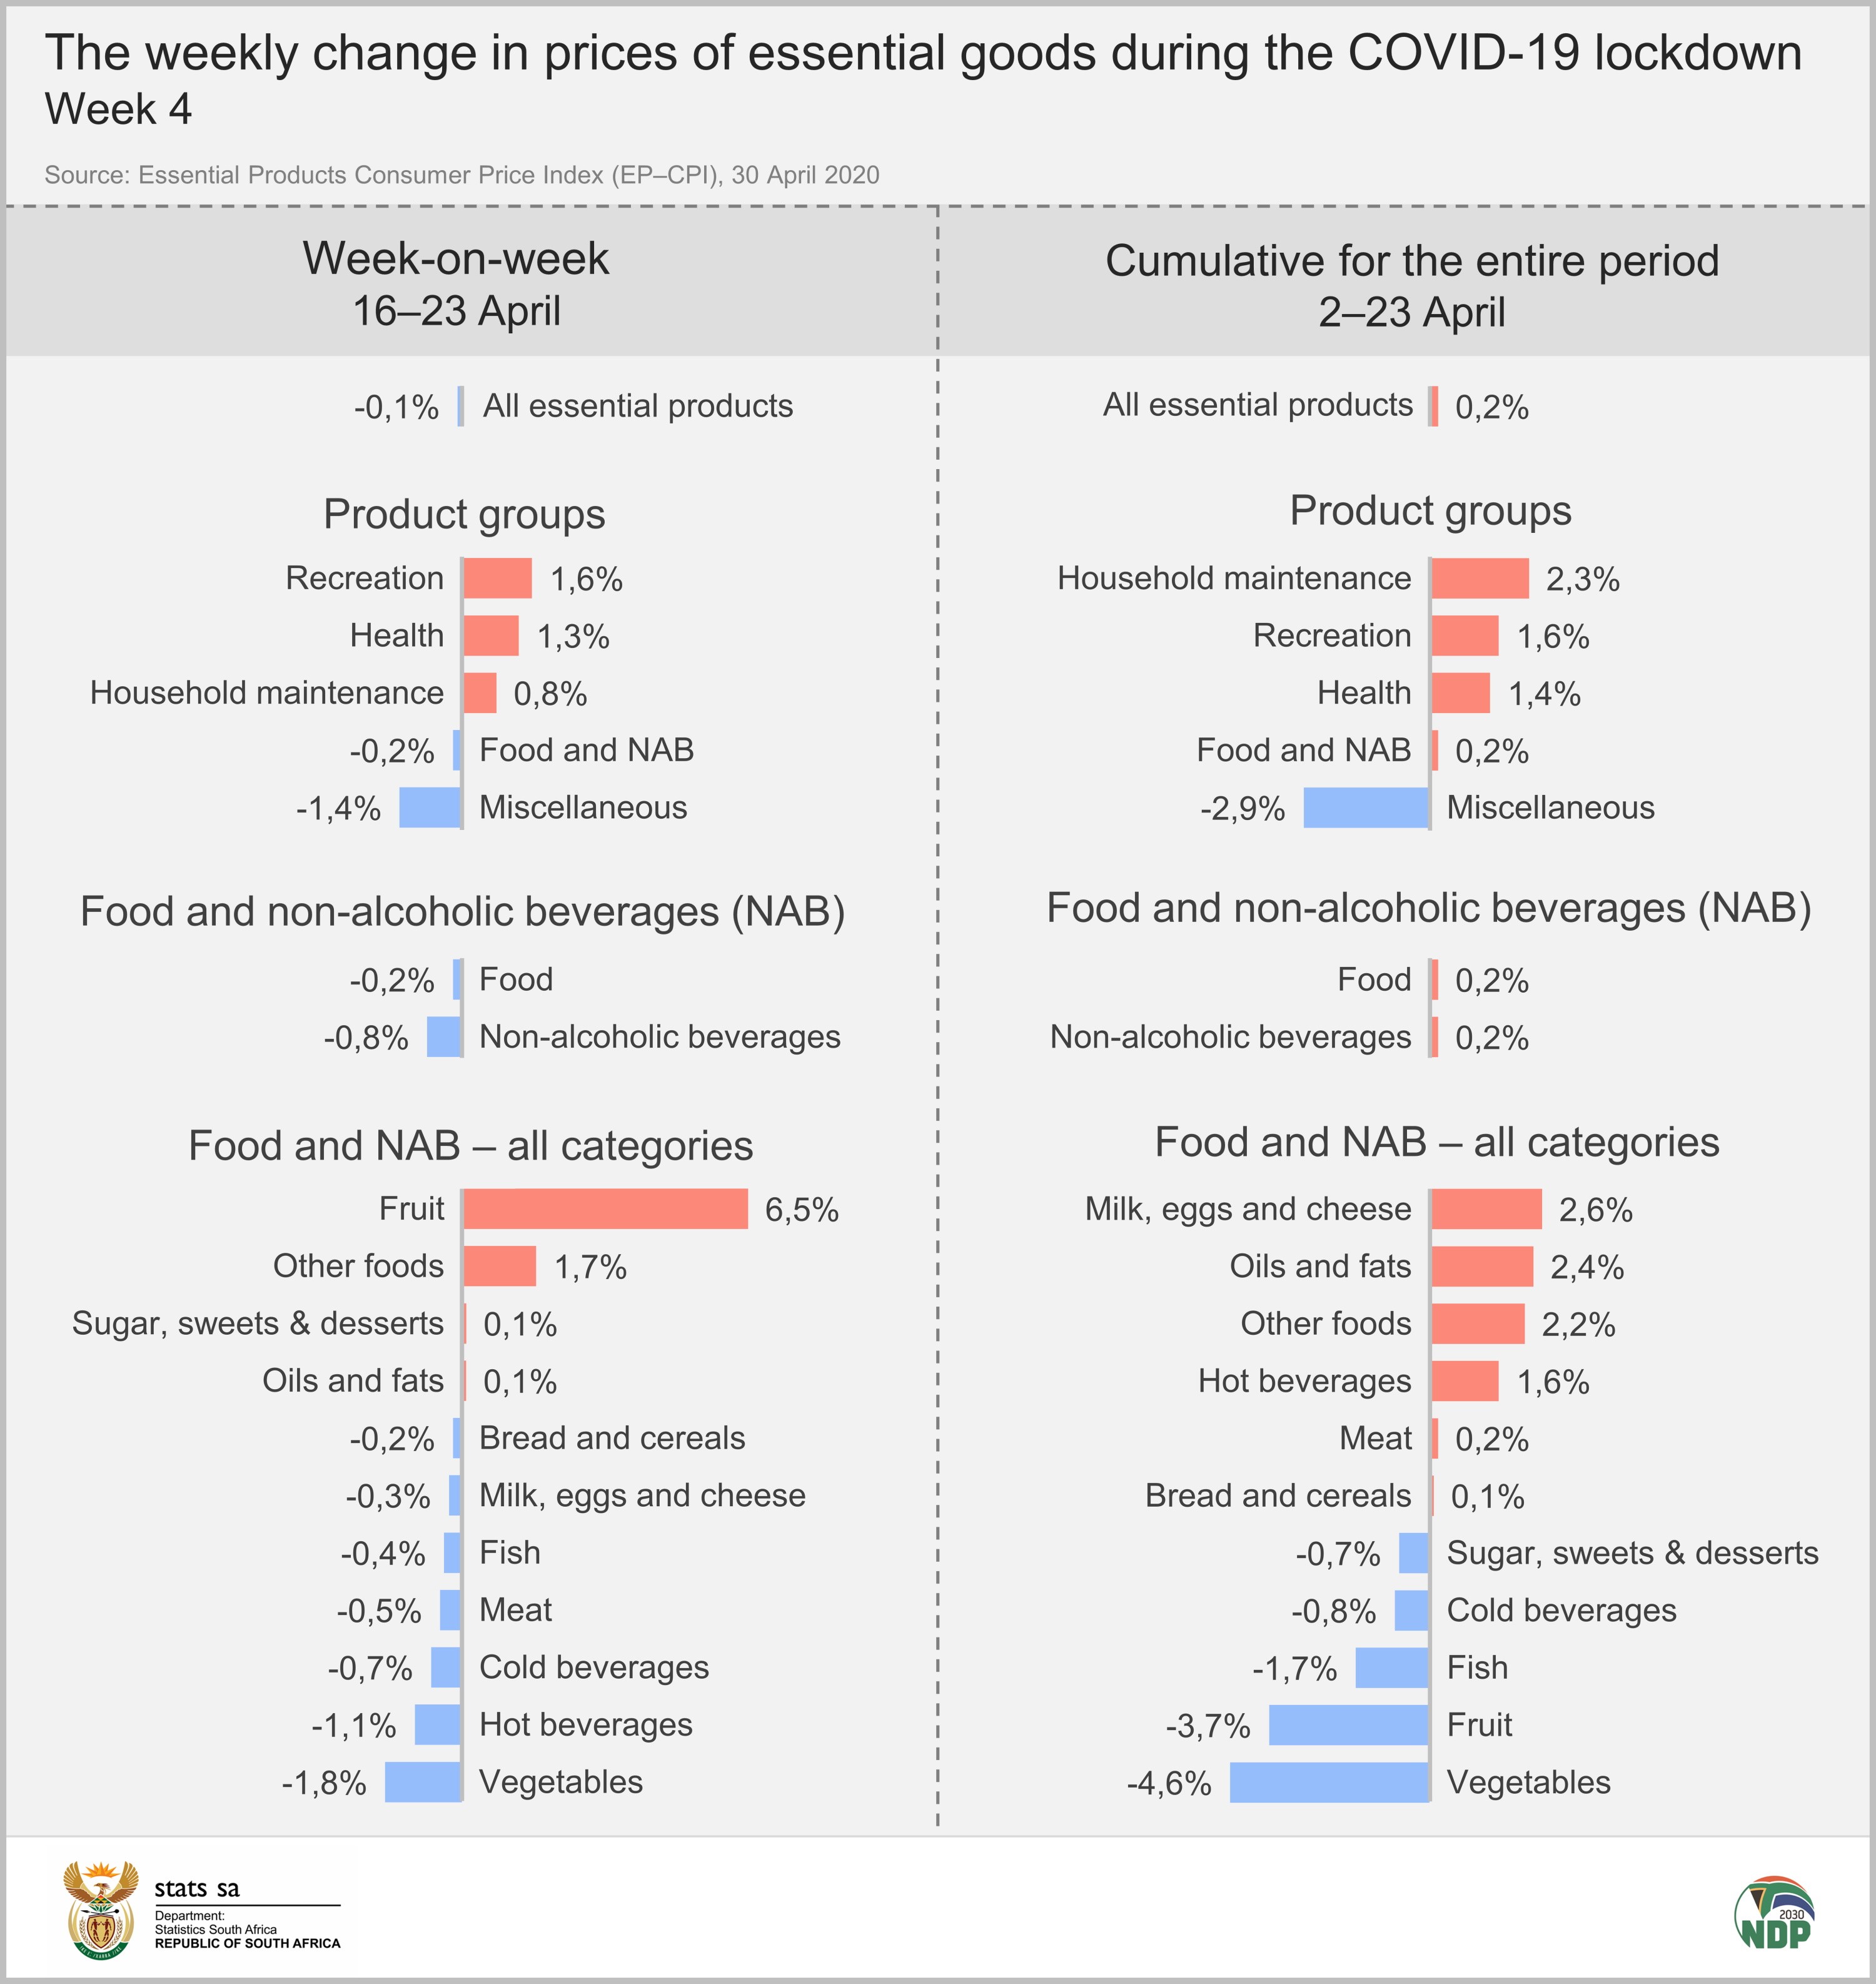
Food and non-alcoholic beverage (NAB) prices decreased by 0,2% in each of the last two weeks, but a cumulative increase of 0,2% was observed over the entire period.
Large cumulative price increases were recorded in milk, eggs and cheese (2,6%) and oils and fats (2,4%). Vegetable, fruit, and fish products decreased by 4,6%, 3,7% and 1,7% respectively.
Five of the nine food categories decreased in the most recent week, including bread and cereals (-0,2%), meat (-0,5%) and vegetables (-1,8%). Fruit and other foods increased by 6,5% and 1,7% respectively.
Bread and cereal products decreased by 0,2% in the week ending 23 April. Rice prices dropped by 2,8%, sweet biscuits by 2,6% and frozen pastry products by 11,4%.
An 8,2% decrease in prices for cheddar cheese contributed to a weekly decrease in the milk, eggs and cheese index.
Margerine spread prices dropped by 5,6% and peanut butter dropped by 3,8%, whereas cooking oil increased by 3,5%, which together resulted in a 0,1% weekly increase in oils and fats.
Hot and cold beverage prices fell in the week ending 23 April. Hot beverage prices decreased by 1,1%, led by changes of -4% for instant coffee and -3,8% for drinking chocolate. Cold beverage prices dropped by 0,7%, mainly a result of a decrease of 2,7% in canned fizzy drinks.
The index for household maintenance and supplies saw a weekly increase of 0,8%. Dishwashing liquid (2,5%) and toilet cleaners (2,2%) were the main contributors.
The health index increased by 1,3% and the recreation index by 1,6% in the latest week.
Large price decreases were observed in the prices of toothpaste (-6,4%) and hair conditioner (-4,5%) to bring the weekly change in the miscellaneous products index to ‑1,4%.
How is the EP–CPI calculated?
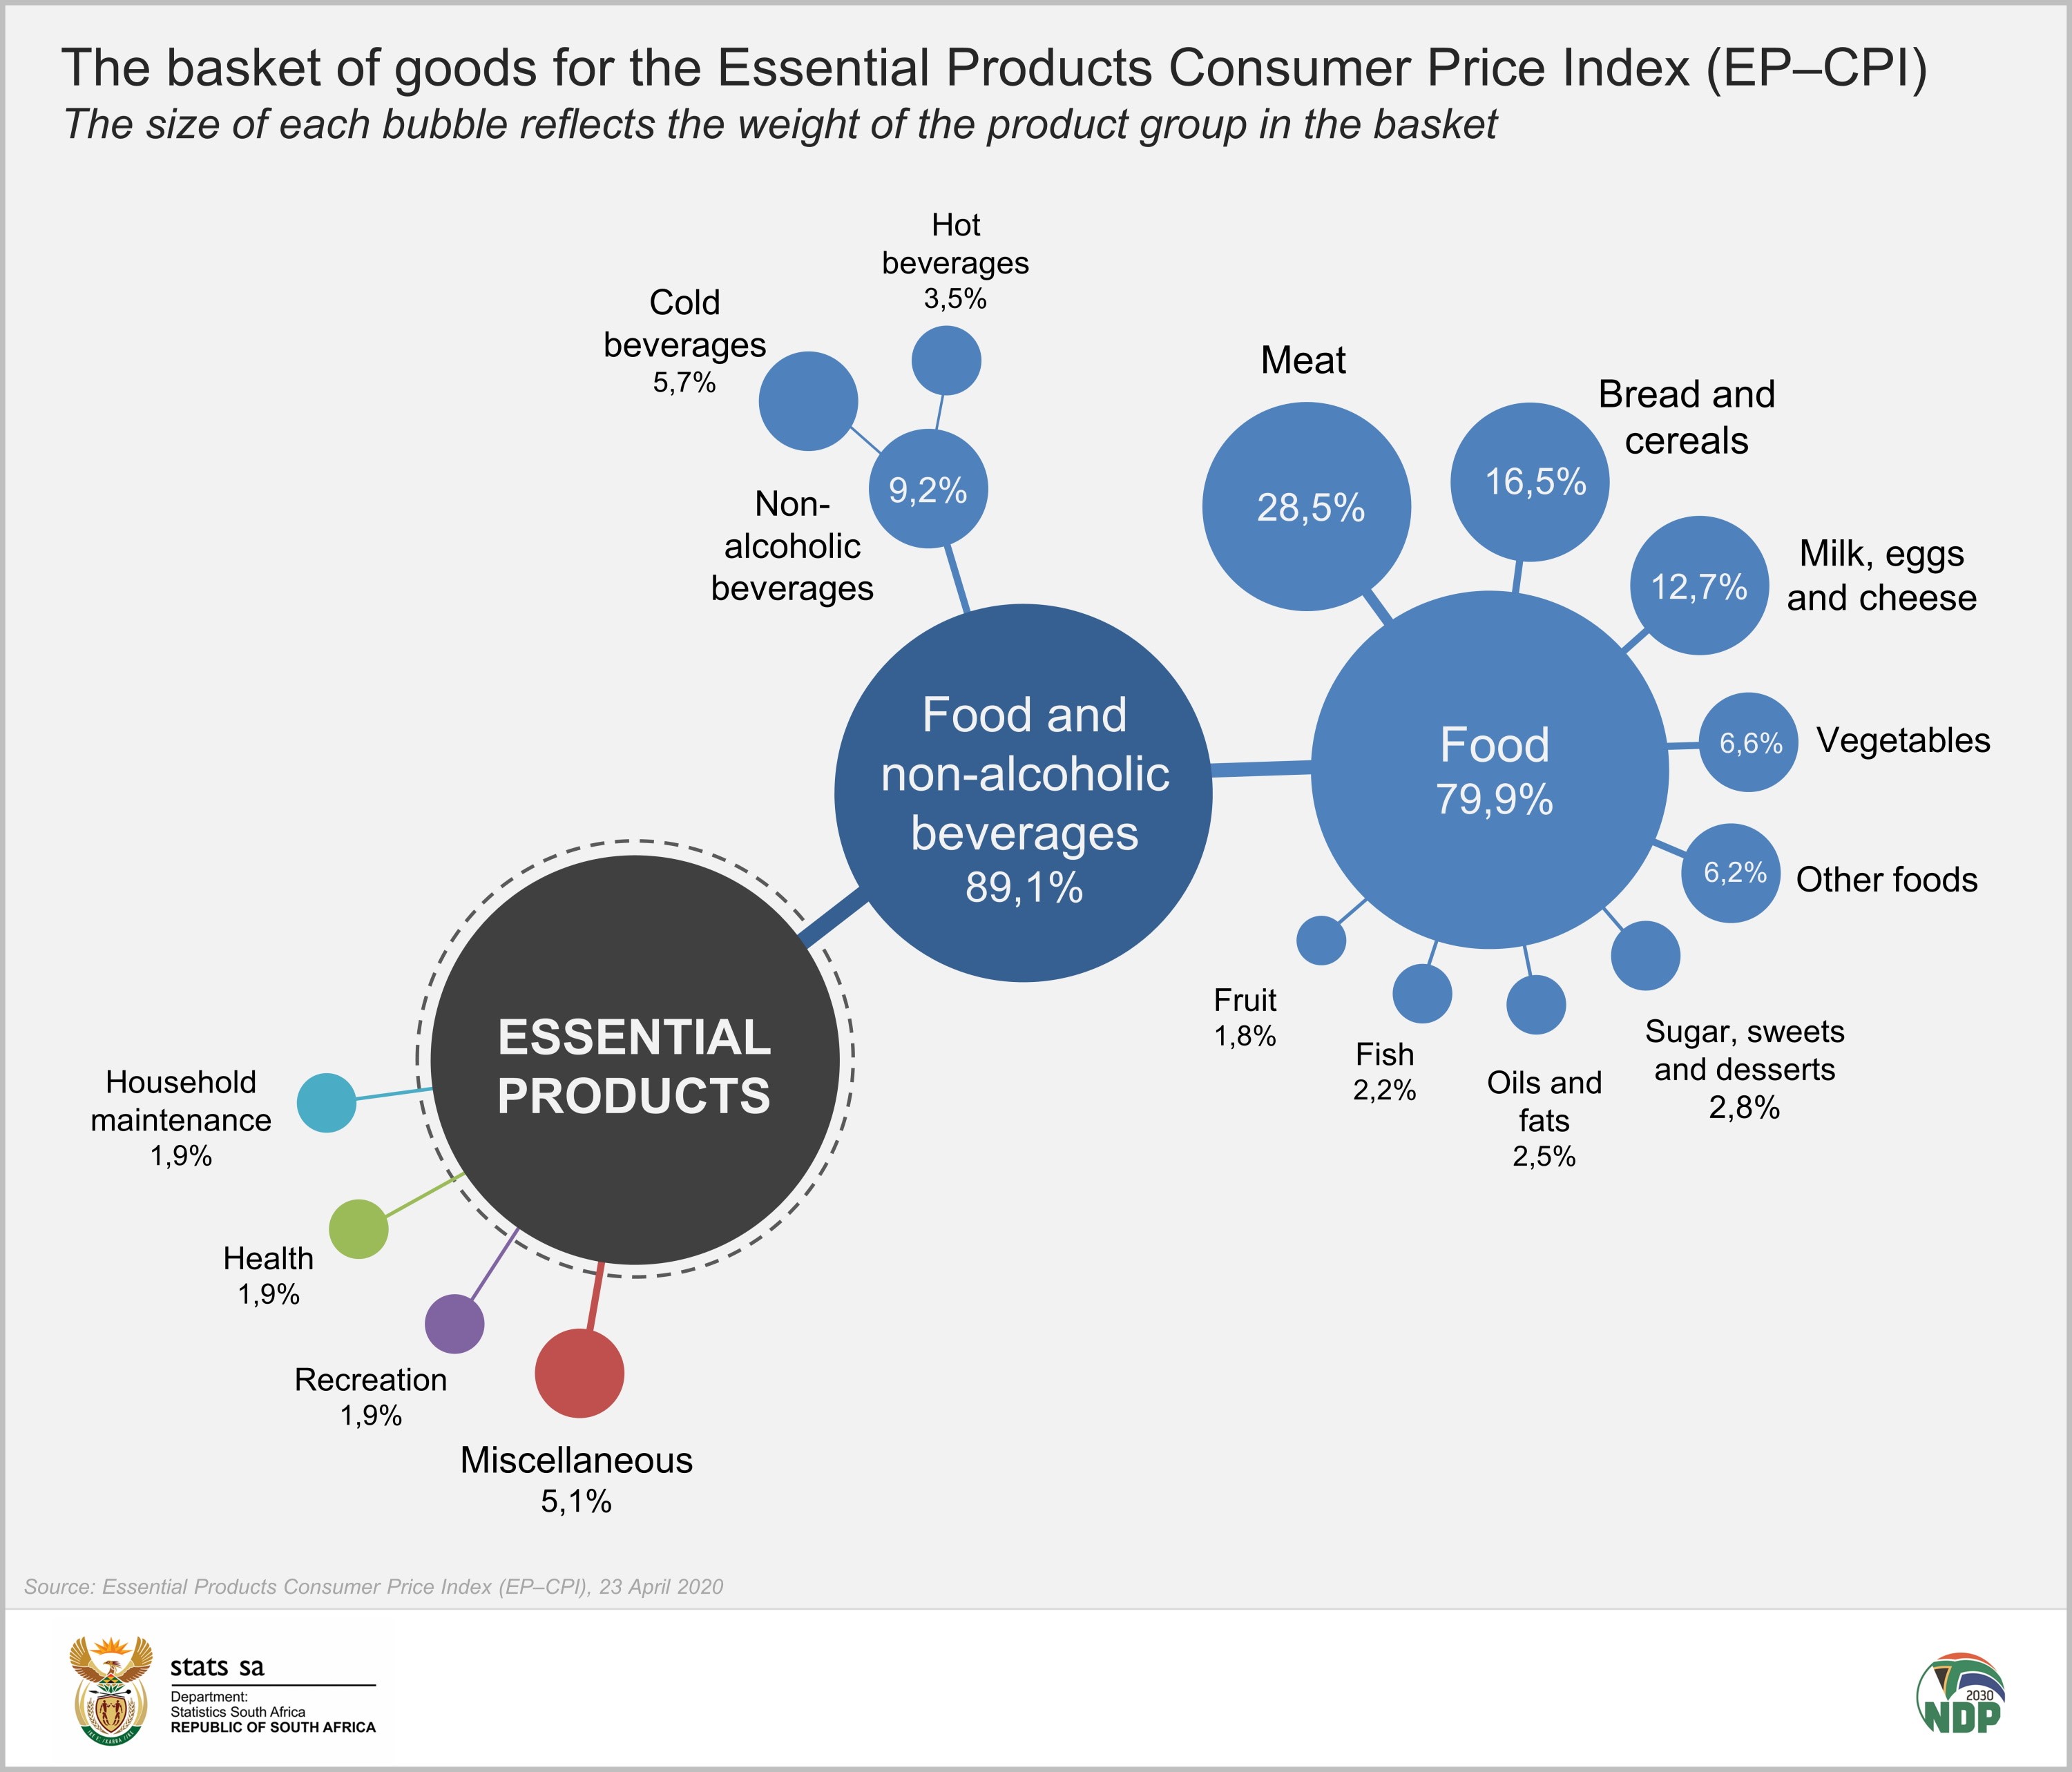
The index is based on a much smaller basket of goods and services, comprising just under 20% of the weight and 187 of the 412 products in the CPI basket. Food and NAB products dominate, comprising 89,1% of the EP–CPI basket.
Since the start of the lockdown, Stats SA has measured price changes for those essential goods that appear in the Consumer Price Index (CPI) basket. The organisation is temporarily publishing this inflation data on a weekly basis, albeit for a smaller range of goods than usual. It is based on product prices from retail stores that were available online.
The index is calculated using the weighted sum of the geometric average price changes. This is the standard index calculation formula used in the CPI.
As pricing typically does not vary according to area of residence when using online shopping portals, it is not possible to calculate regional EP‒CPIs.
Stats SA will continue to release weekly results on prices movements of essential products using this method. This is a temporary project, however, and will run until restrictions on consumer products are lifted. The official CPI will continue to be published every month. The latest monthy CPI release, for March 2020, is available here.
For technical enquires contact:
Patrick Kelly
Chief Director: Price Statistics
082 888 2248
Similar articles are available on the Stats SA website and can be accessed here.
For a monthly overview of economic indicators and infographics, catch the latest edition of the Stats Biz newsletter here.