
COVID-19: Stats SA speeds up the monitoring of consumer prices
When the COVID-19 lockdown went into effect on 27 March, the range of products available to households for purchase was restricted to a set of defined essential goods and services.
Since the beginning of the lockdown, Stats SA has been measuring price changes for those essential goods that appear in the Consumer Price Index (CPI) basket. The organisation is temporarily publishing inflation data on a weekly basis, albeit for a smaller range of goods.
Recording product prices from retail stores online, Stats SA has been able to compile an Essential Products Consumer Price Index (EP–CPI).
Breakfast costs more…large increases in prices of eggs, bread, tea and coffee
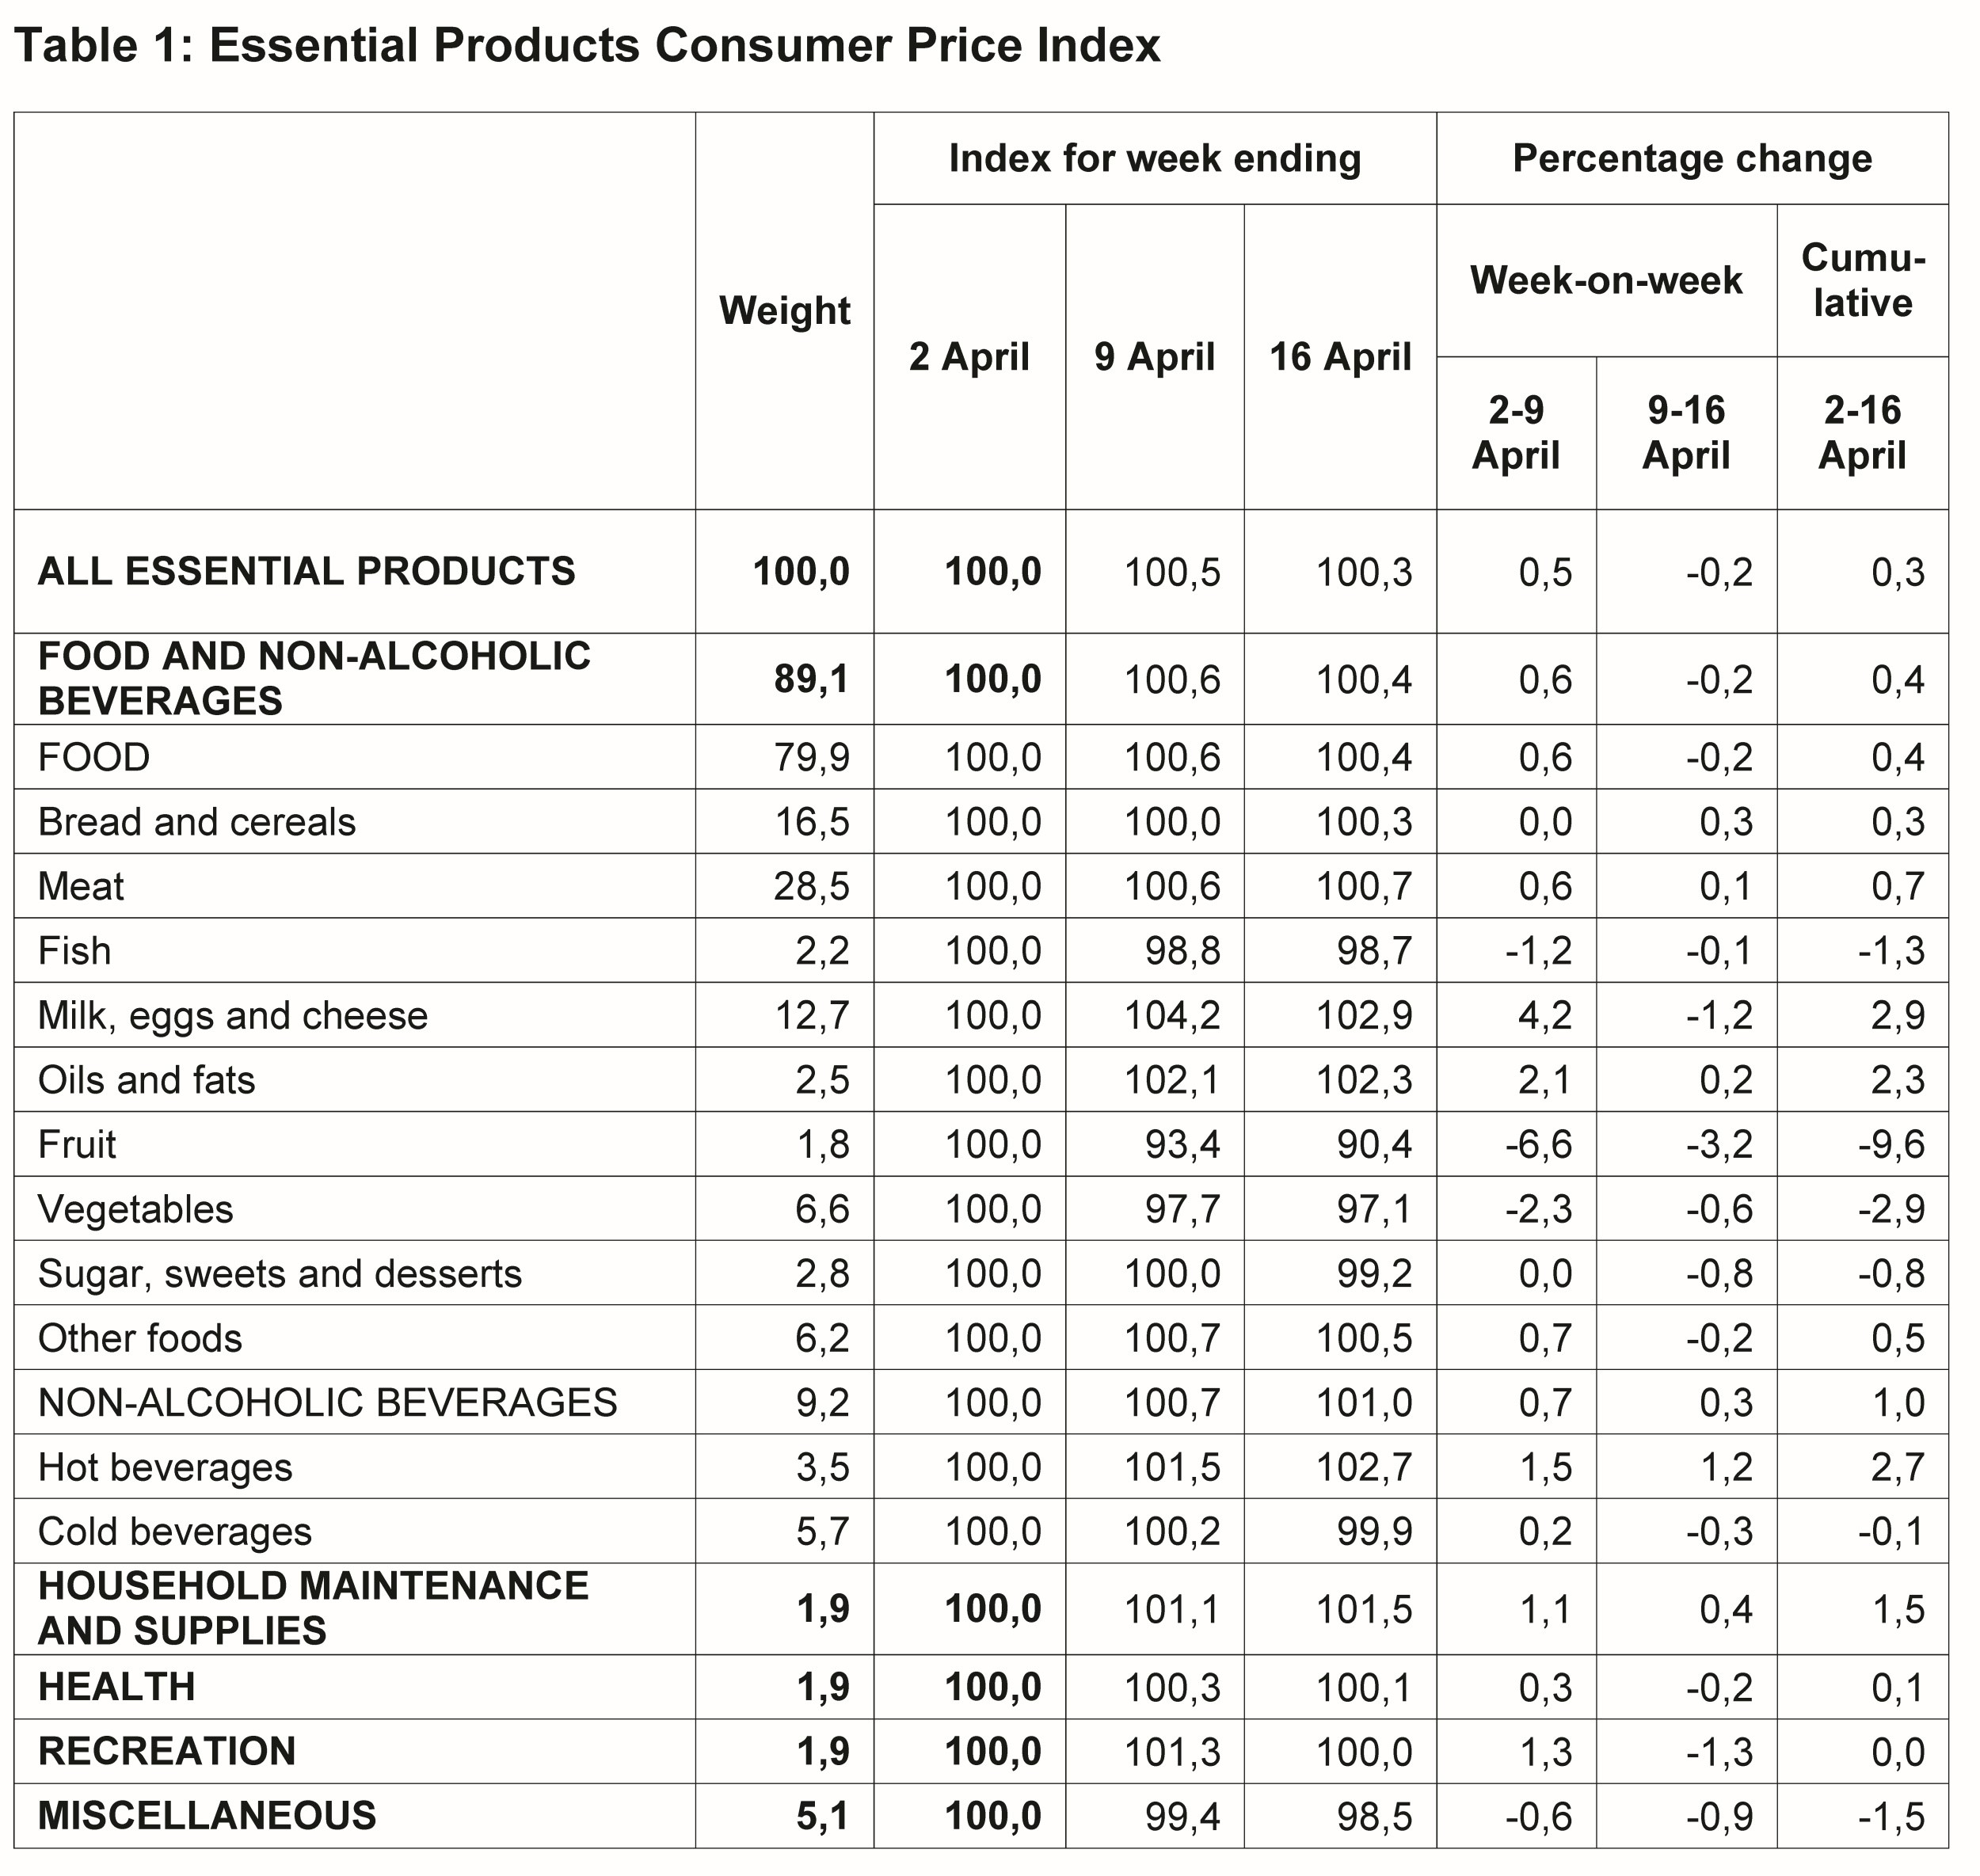
The prices of essential products increased on average by 0,3% between the week ending 2 April (first week of lockdown) and the week ending 16 April (third week of lockdown). The second week of the lockdown saw the prices of essential items increase by 0,5% week-on-week, followed by a decrease of 0,2% week-on-week in the third week (click on the chart to enlarge)
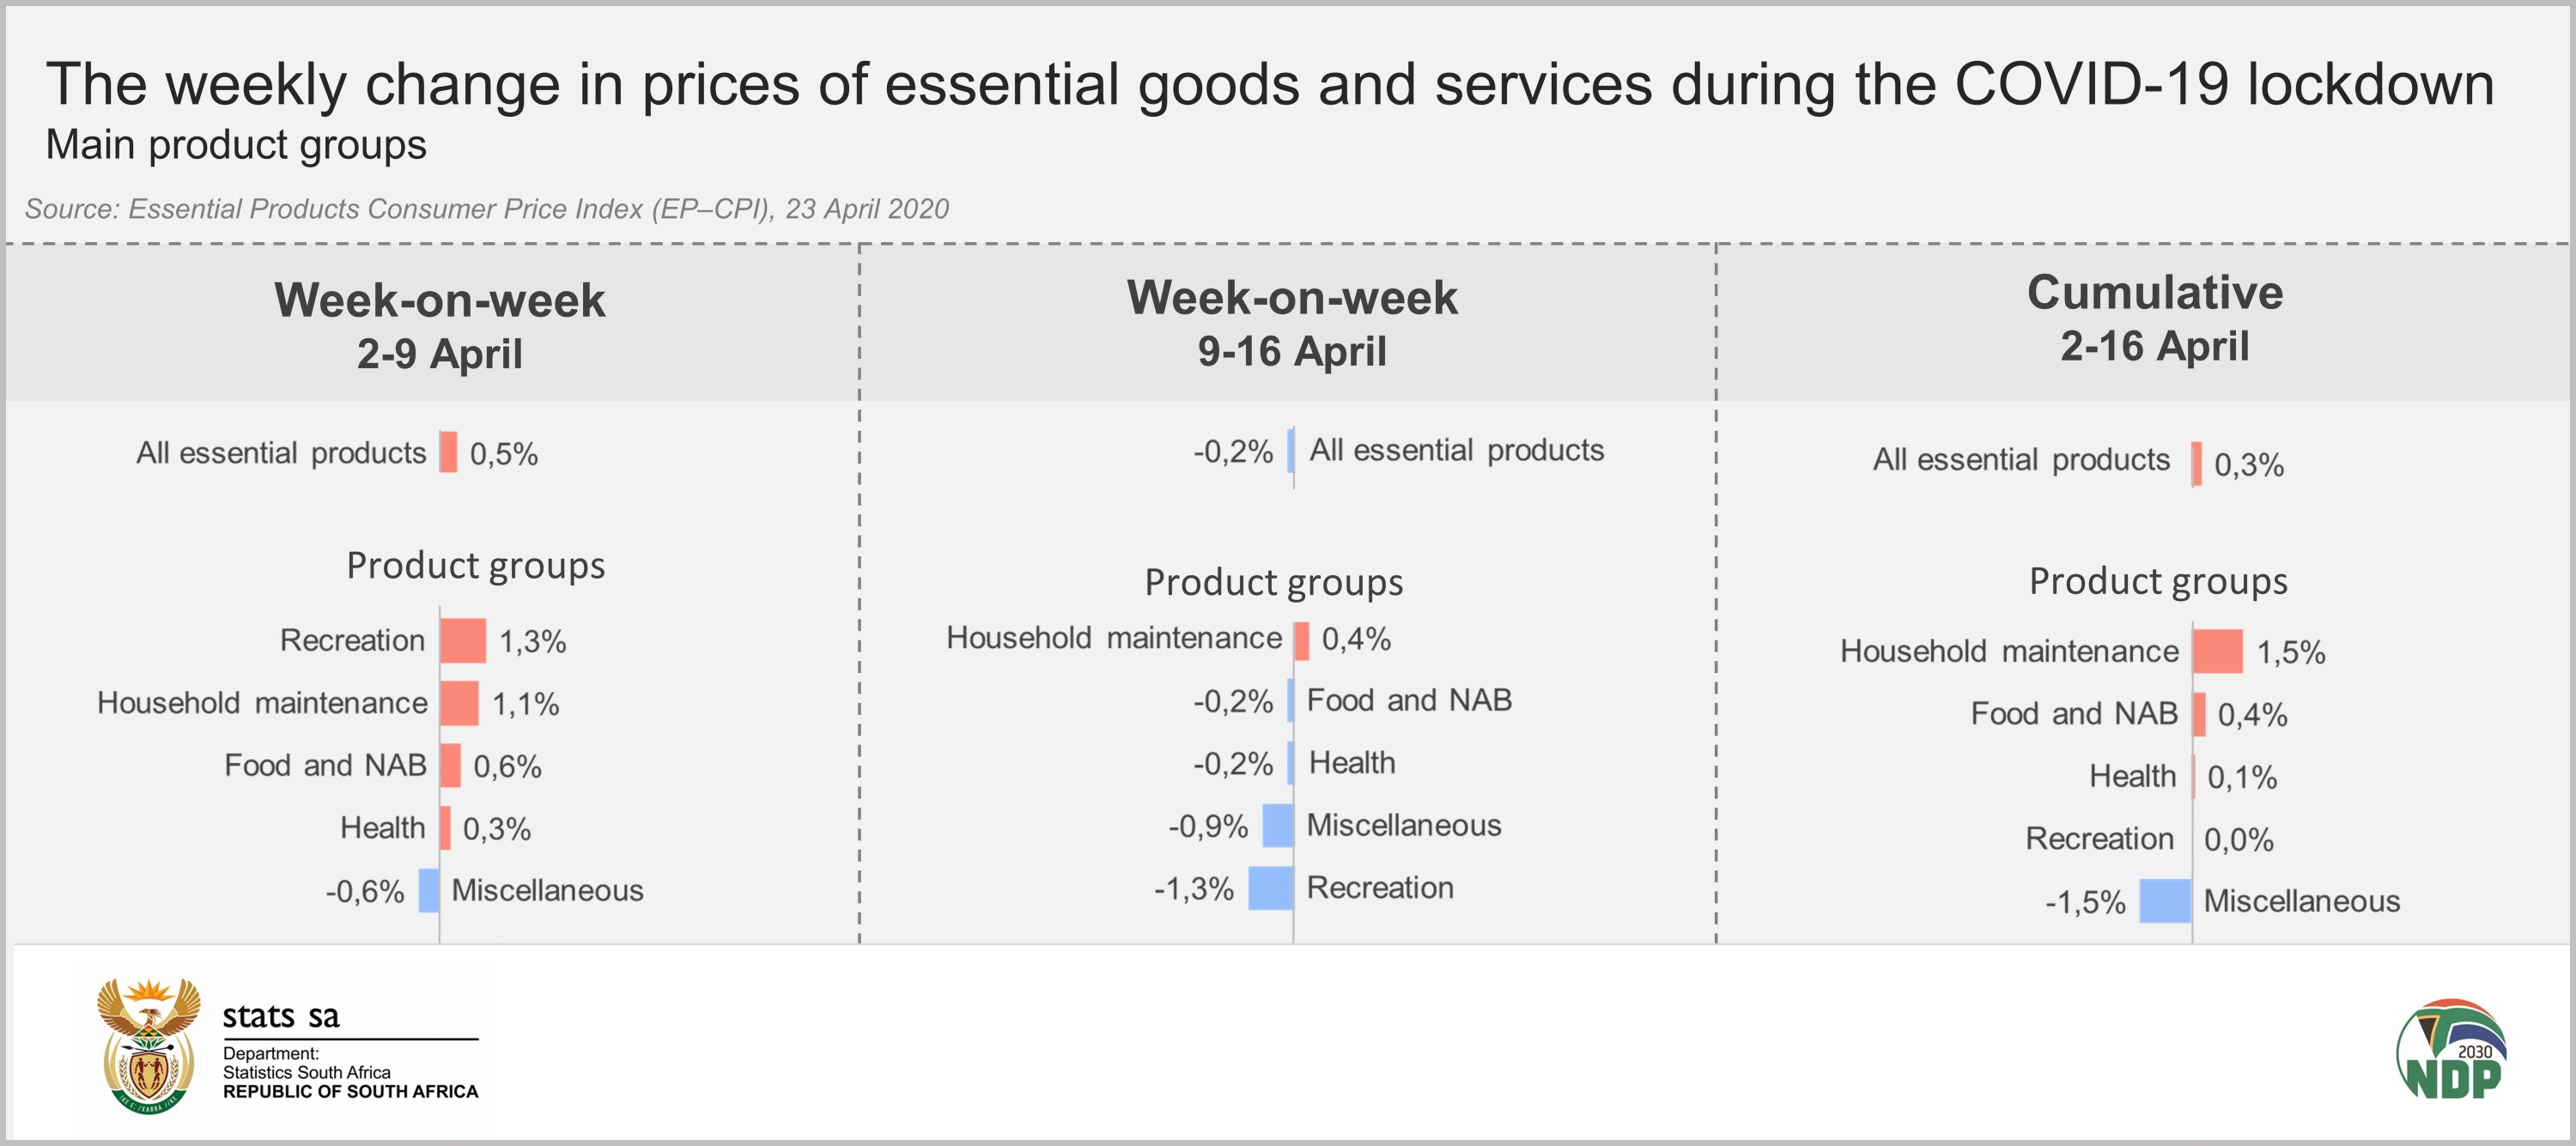
Food and non-alcoholic beverages (NAB) prices (which comprise almost 90% of the index) increased by 0,4% over the two weeks. This is equivalent to the average monthly change in the CPI Food and NAB index over the past six months to March 2020
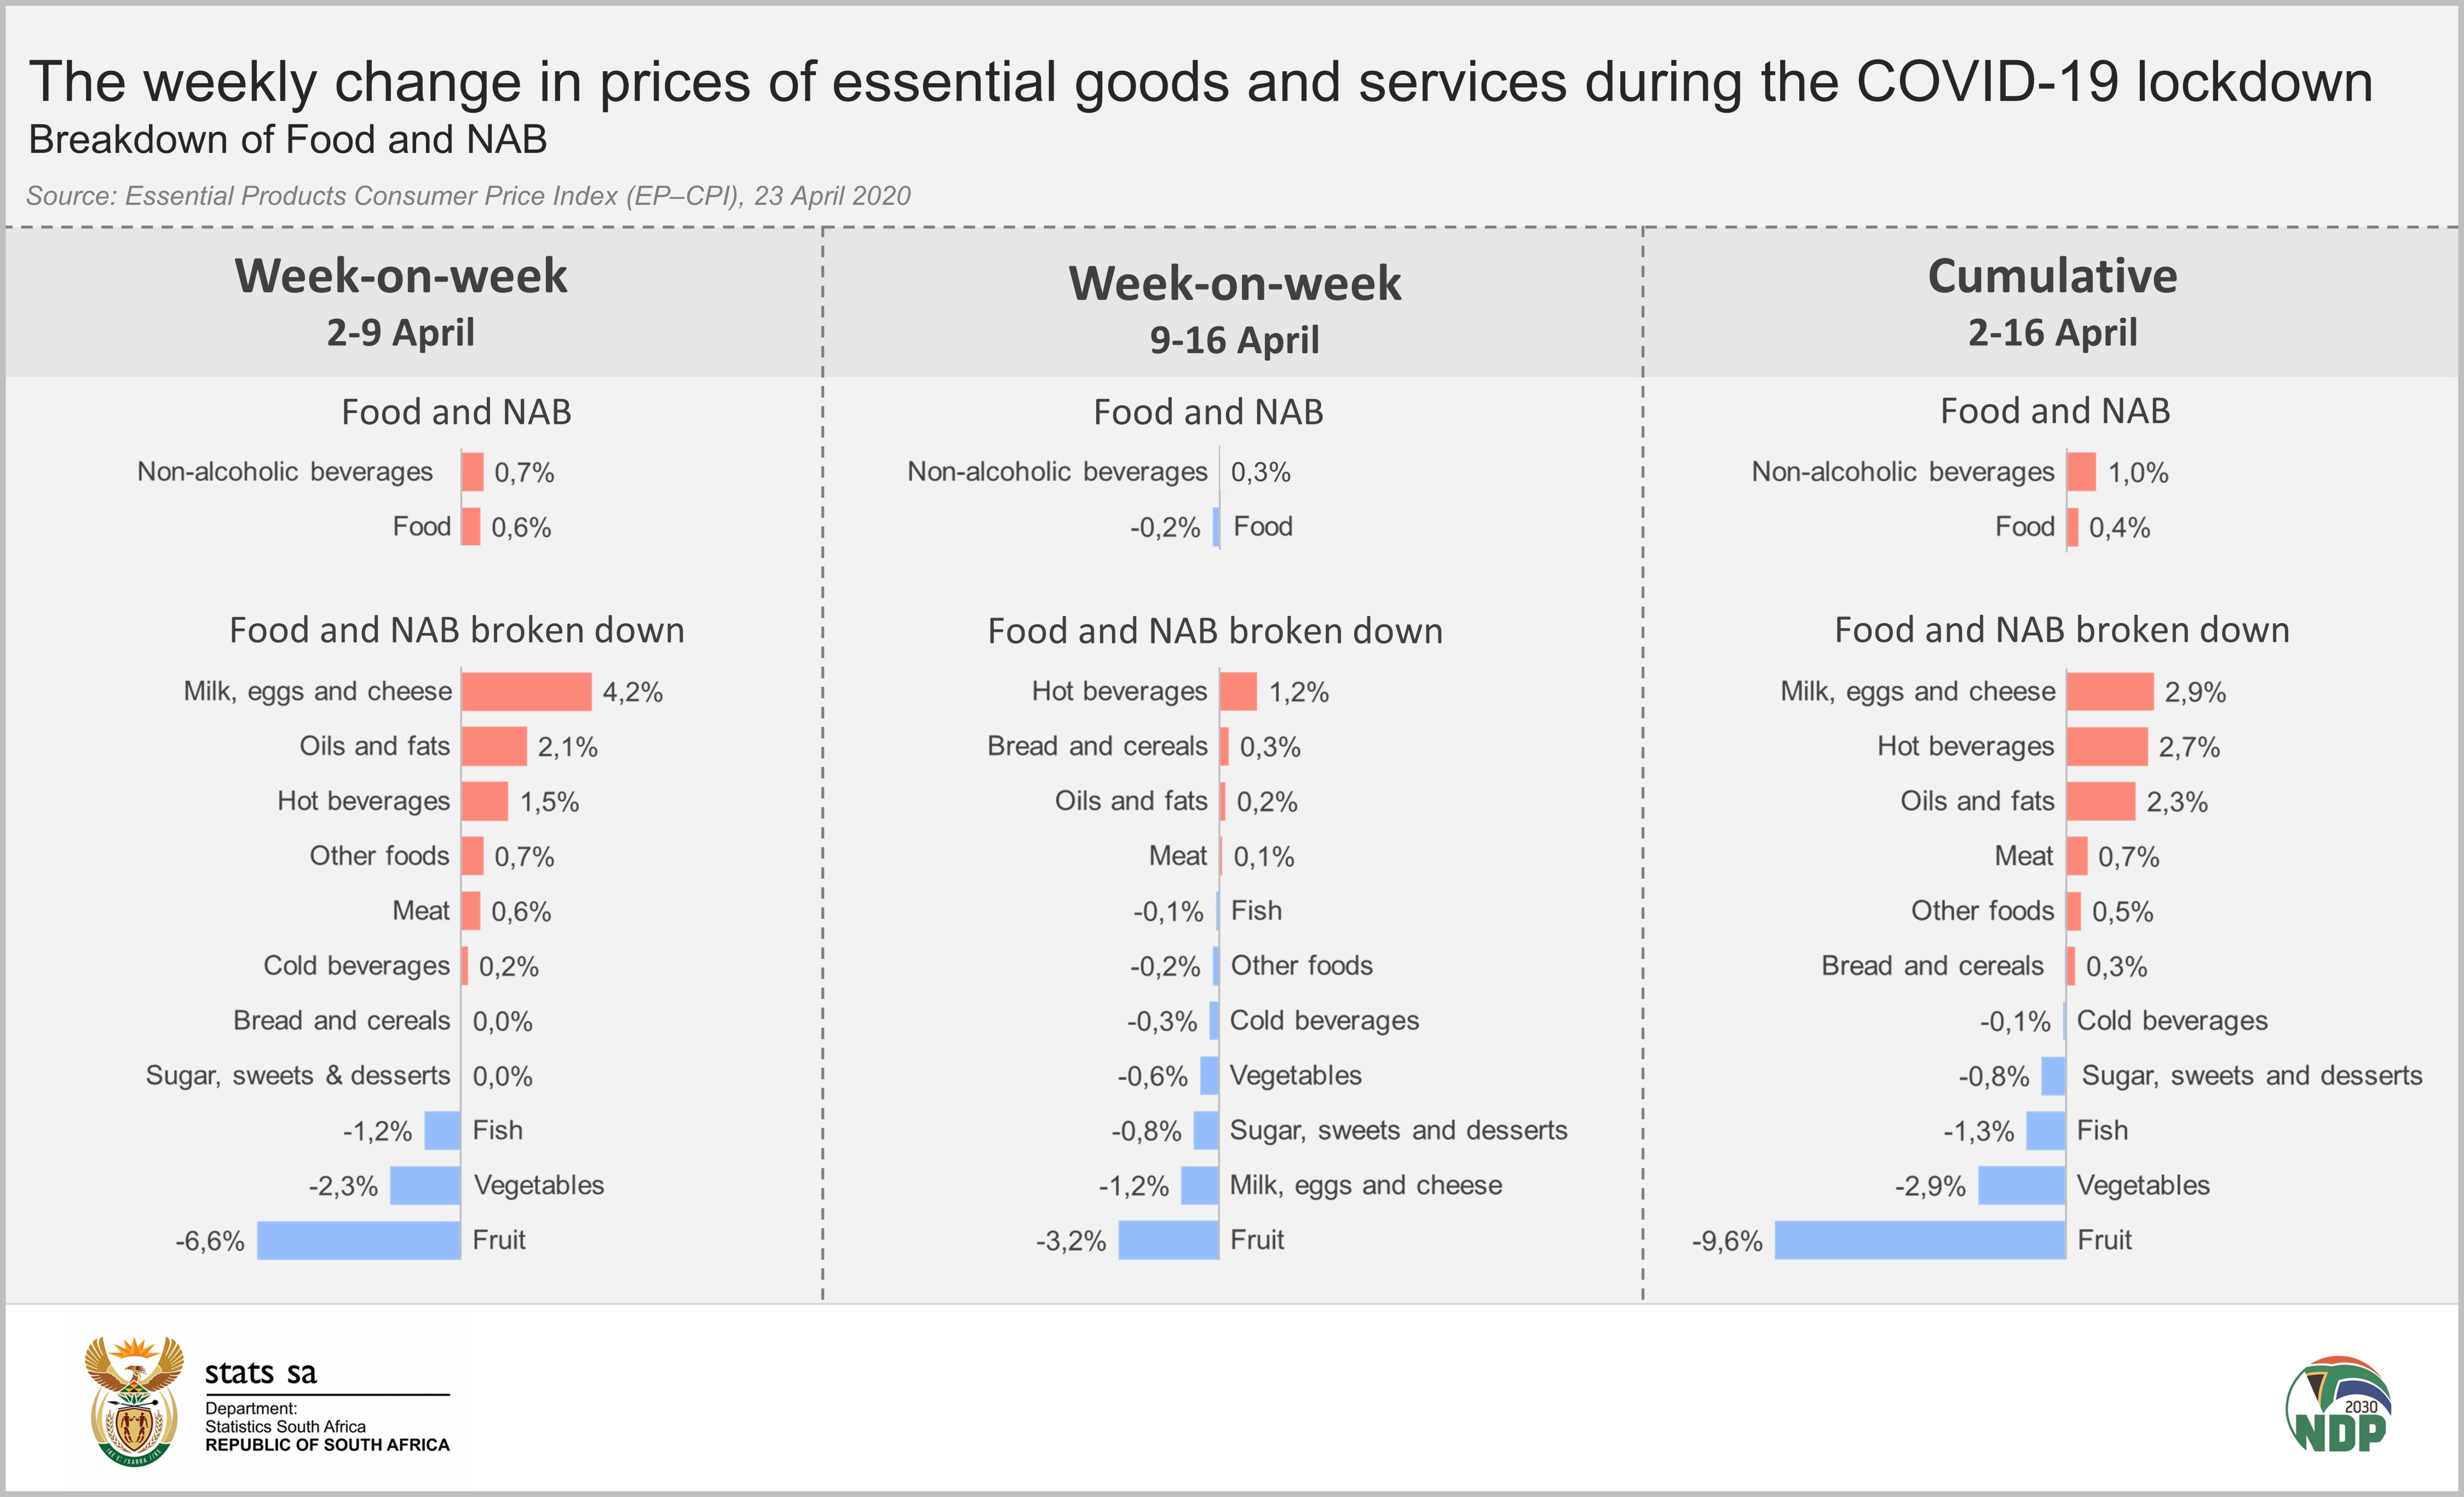
Taking a closer look at products within the Food and NAB group, the products that experienced the biggest price rises between 2 and 16 April were milk, eggs and cheese, increasing by 2,9%, hot beverages (up 2,7%), and oils and fats (up 2,3%).
The 2,9% increase in the milk, eggs and cheese index was mainly caused by a 19% increase in the prices of eggs.
Increases of 2,8% for instant coffee and 7,2% for black tea pushed the hot beverages index higher. Rooibos tea prices dropped by 4,8% over the three week period.
An average 4,0% increase in cooking oil prices in the week of 9 April led the rise in the oils and fats category.
Average increases of 7,2% for beef mince and decreases of between 1,2% and 4,1% for chicken products resulted in a 0,7% aggregate increase for meat products.
The bread and cereals index increased by a cumulative 0,3%, with white and brown bread prices increasing by 1,9% and 1,8% respectively.
Fruit and vegetable prices – which are typically highly volatile – decreased by 9,6% and 2,9% respectively.
Washing yourself costs less but your dishes more
The miscellaneous products index, which comprises personal care products, was dragged lower mainly by large decreases in the indices for shampoo (‑7,2%), bath soap (‑4,6%) and tissues (‑2,5%).
Prices for household detergents (the components of household maintenance and supplies index) increased by 1,5%, mainly a result of an average 4,4% rise in the price of dishwashing liquid.
How is the EP–CPI calculated?
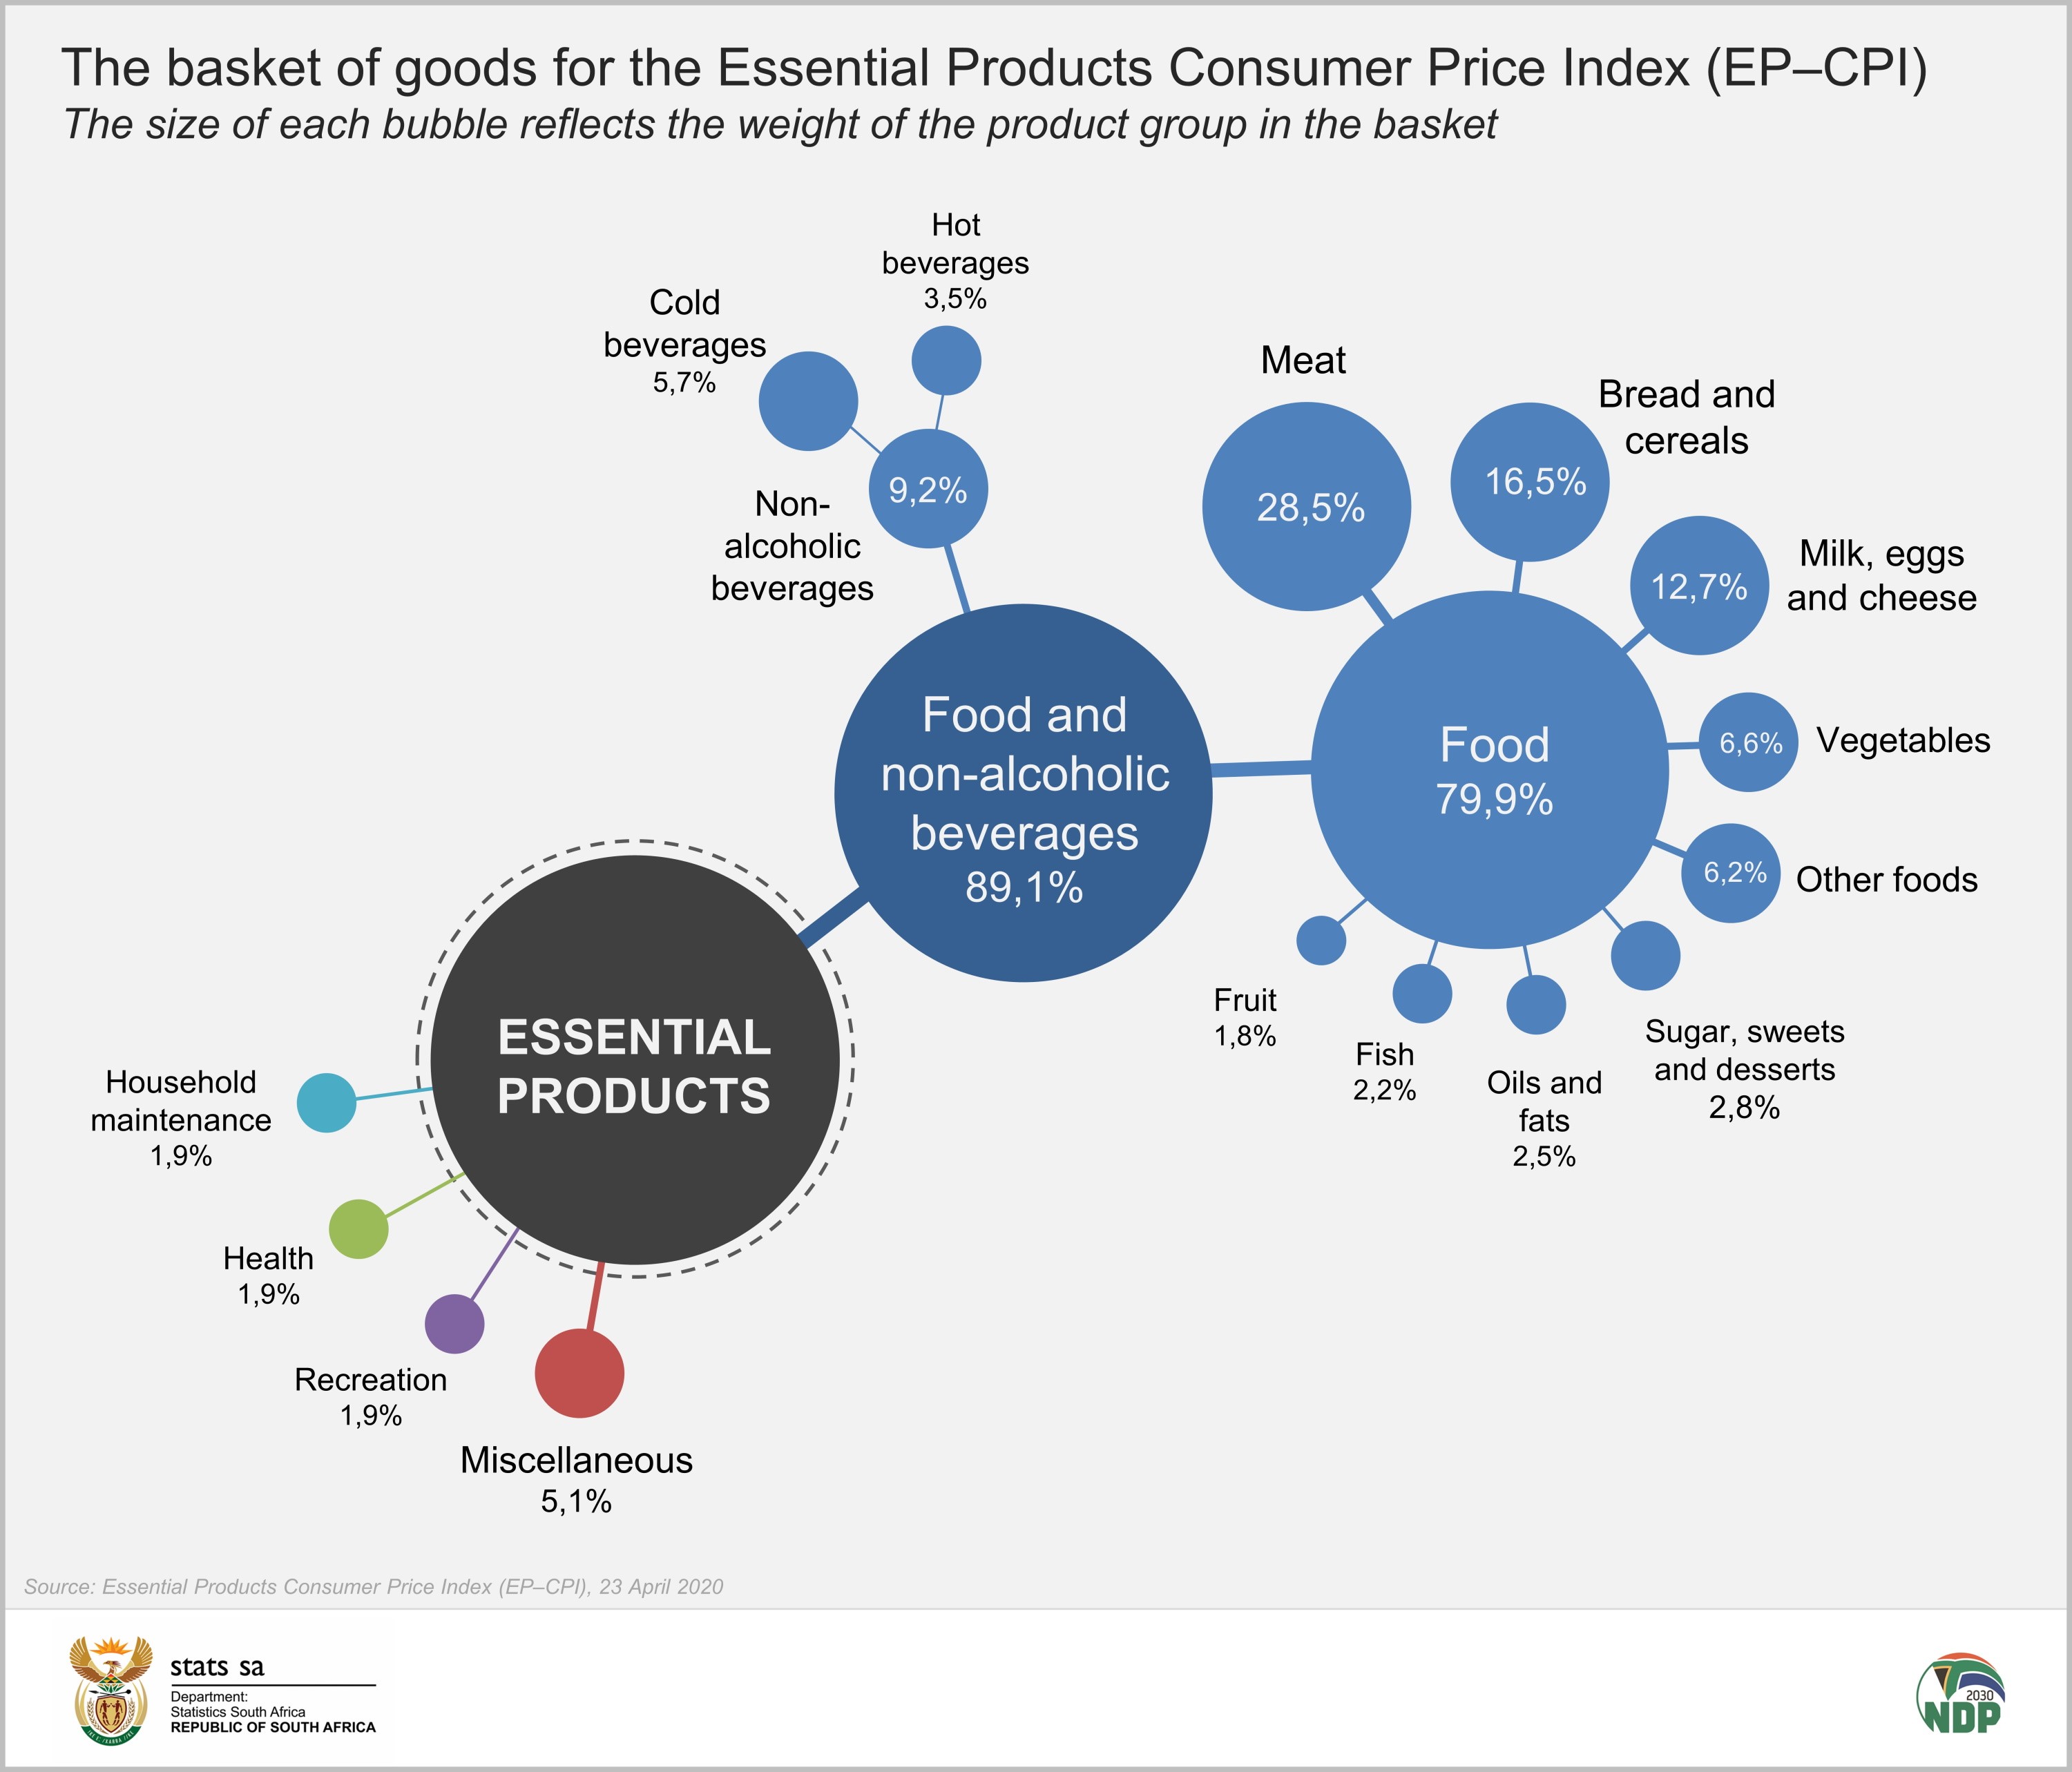
The index is based on a much smaller basket of goods and services, comprising just under 20% of the weight and 187 of the 412 products in the CPI basket. Food and NAB products dominate, comprising 89,1% of the EP–CPI basket.
The index is calculated using the weighted sum of the geometric average price changes. This is the standard index calculation formula used in the CPI.
As pricing typically does not vary according to area of residence when using online shopping portals, it is not possible to calculate regional EP-CPIs.
Stats SA will continue to release weekly results on prices movements of essential products using this method. This is a temporary project, however, and will run until restrictions on consumer products are lifted. The official CPI will continue to be published every month. The latest monthy CPI release, for March 2020, is available here.
The results from the EP-CPI are included in the table below.
For technical enquires contact:
Patrick Kelly
Chief Director: Price Statistics
082 888 2248
Similar articles are available on the Stats SA website and can be accessed here.
For a monthly overview of economic indicators and infographics, catch the latest edition of the Stats Biz newsletter here.