
An update to municipal spending and revenue (December 2019)
South Africa’s 257 municipalities spent a total of R95,2 billion in the quarter ended December 2019 (October to December). This is how much it costs municipalities to provide services – such as water, electricity and sanitation – to millions of households across the country.
The R95,2 billion was higher than the R84,4 billion that was spent in the quarter ended December 2018, according to the latest Quarterly financial statistics of municipalities report.1 This represents an increase of 12,7%, driven mostly by municipalities buying more electricity, as well as increases in employee-related costs.
Employee-related costs – expenditure on salaries and wages2 – amounted to R28,7 billion, or 30,1% of total municipal spending. This represents a 7,4% rise from the R26,7 billion recorded in the quarter ended December 2018.
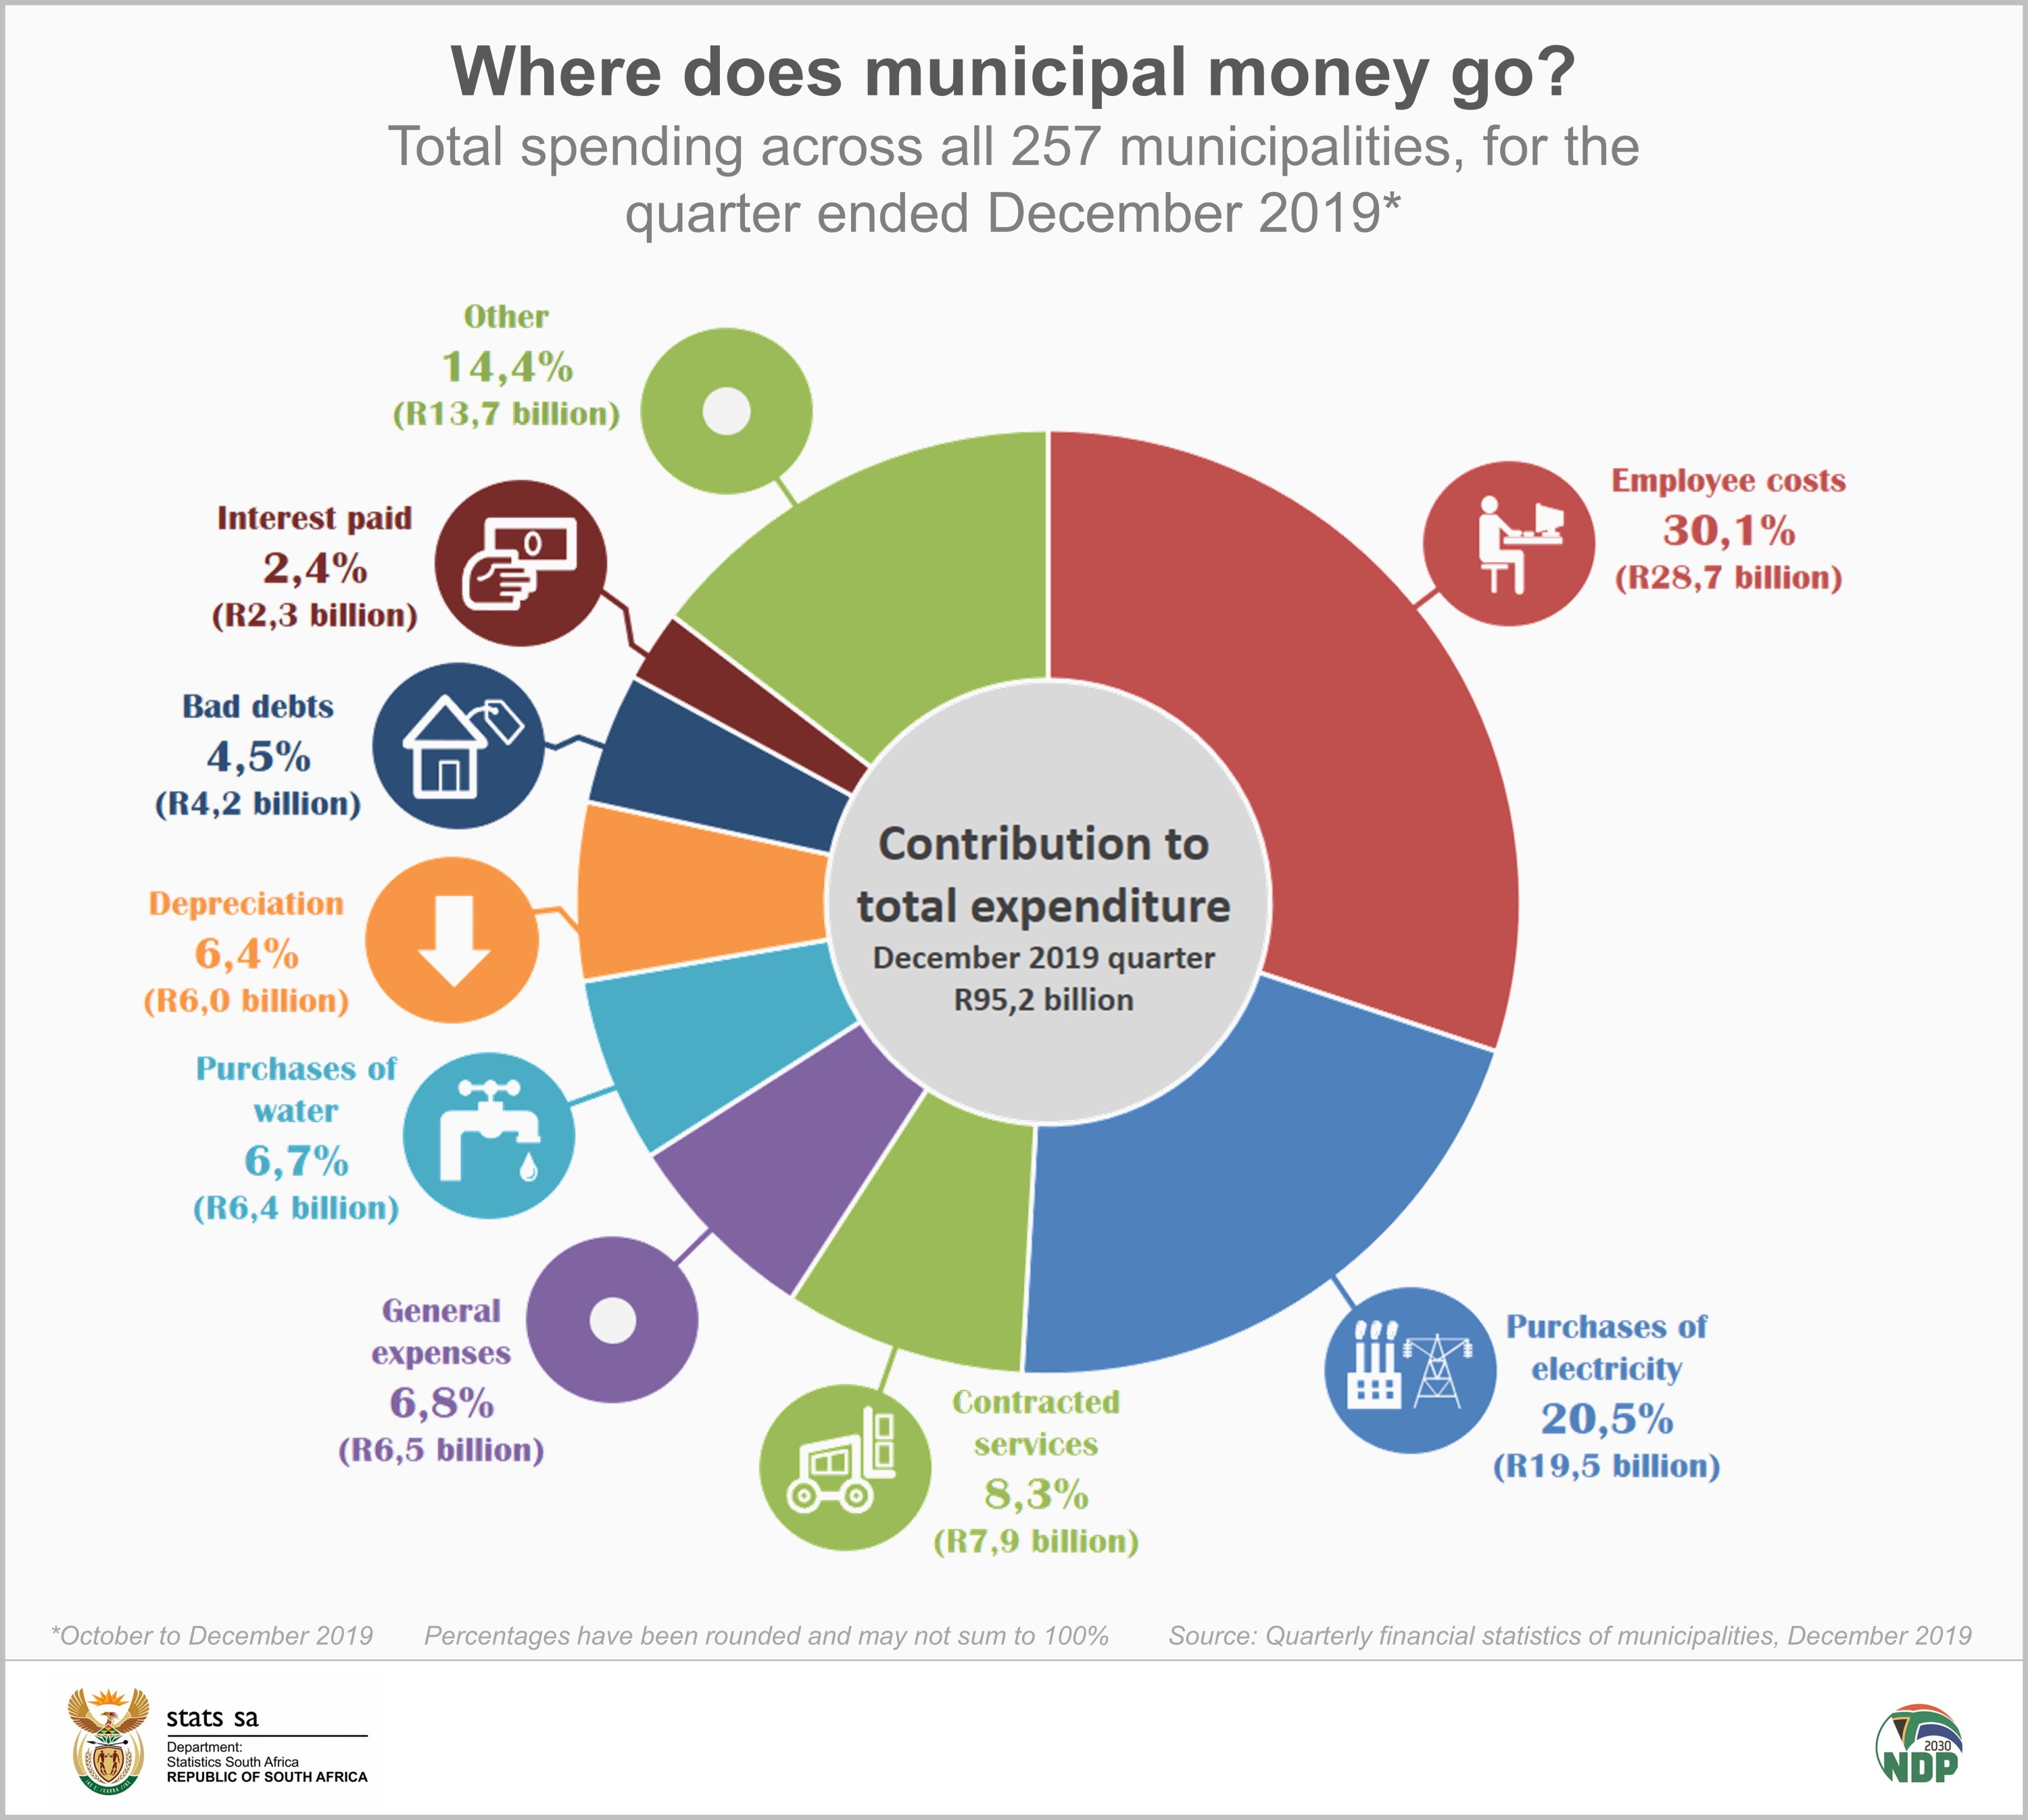
Purchases of electricity was the second biggest expenditure item, accounting for R19,5 billion (or 20,5% of total spending). This is 12,4% higher than the R17,4 billion recorded during the same period in 2018.
Municipalities purchase electricity from Eskom which is resold to households, businesses and other institutions. Municipalities sold electricity to the value of R28,1 billion in the quarter ended December 2019, exceeding the cost of it by R8,6 billion.
The third biggest expenditure item was contracted services, followed by general expenses (which entails amongst others, fuel and oil, audit fees, accommodation and travelling costs, and hiring of plant and equipment) and purchases of water. Depreciation, the sixth biggest item, includes wear and tear as well as amortisation costs for intangible assets.
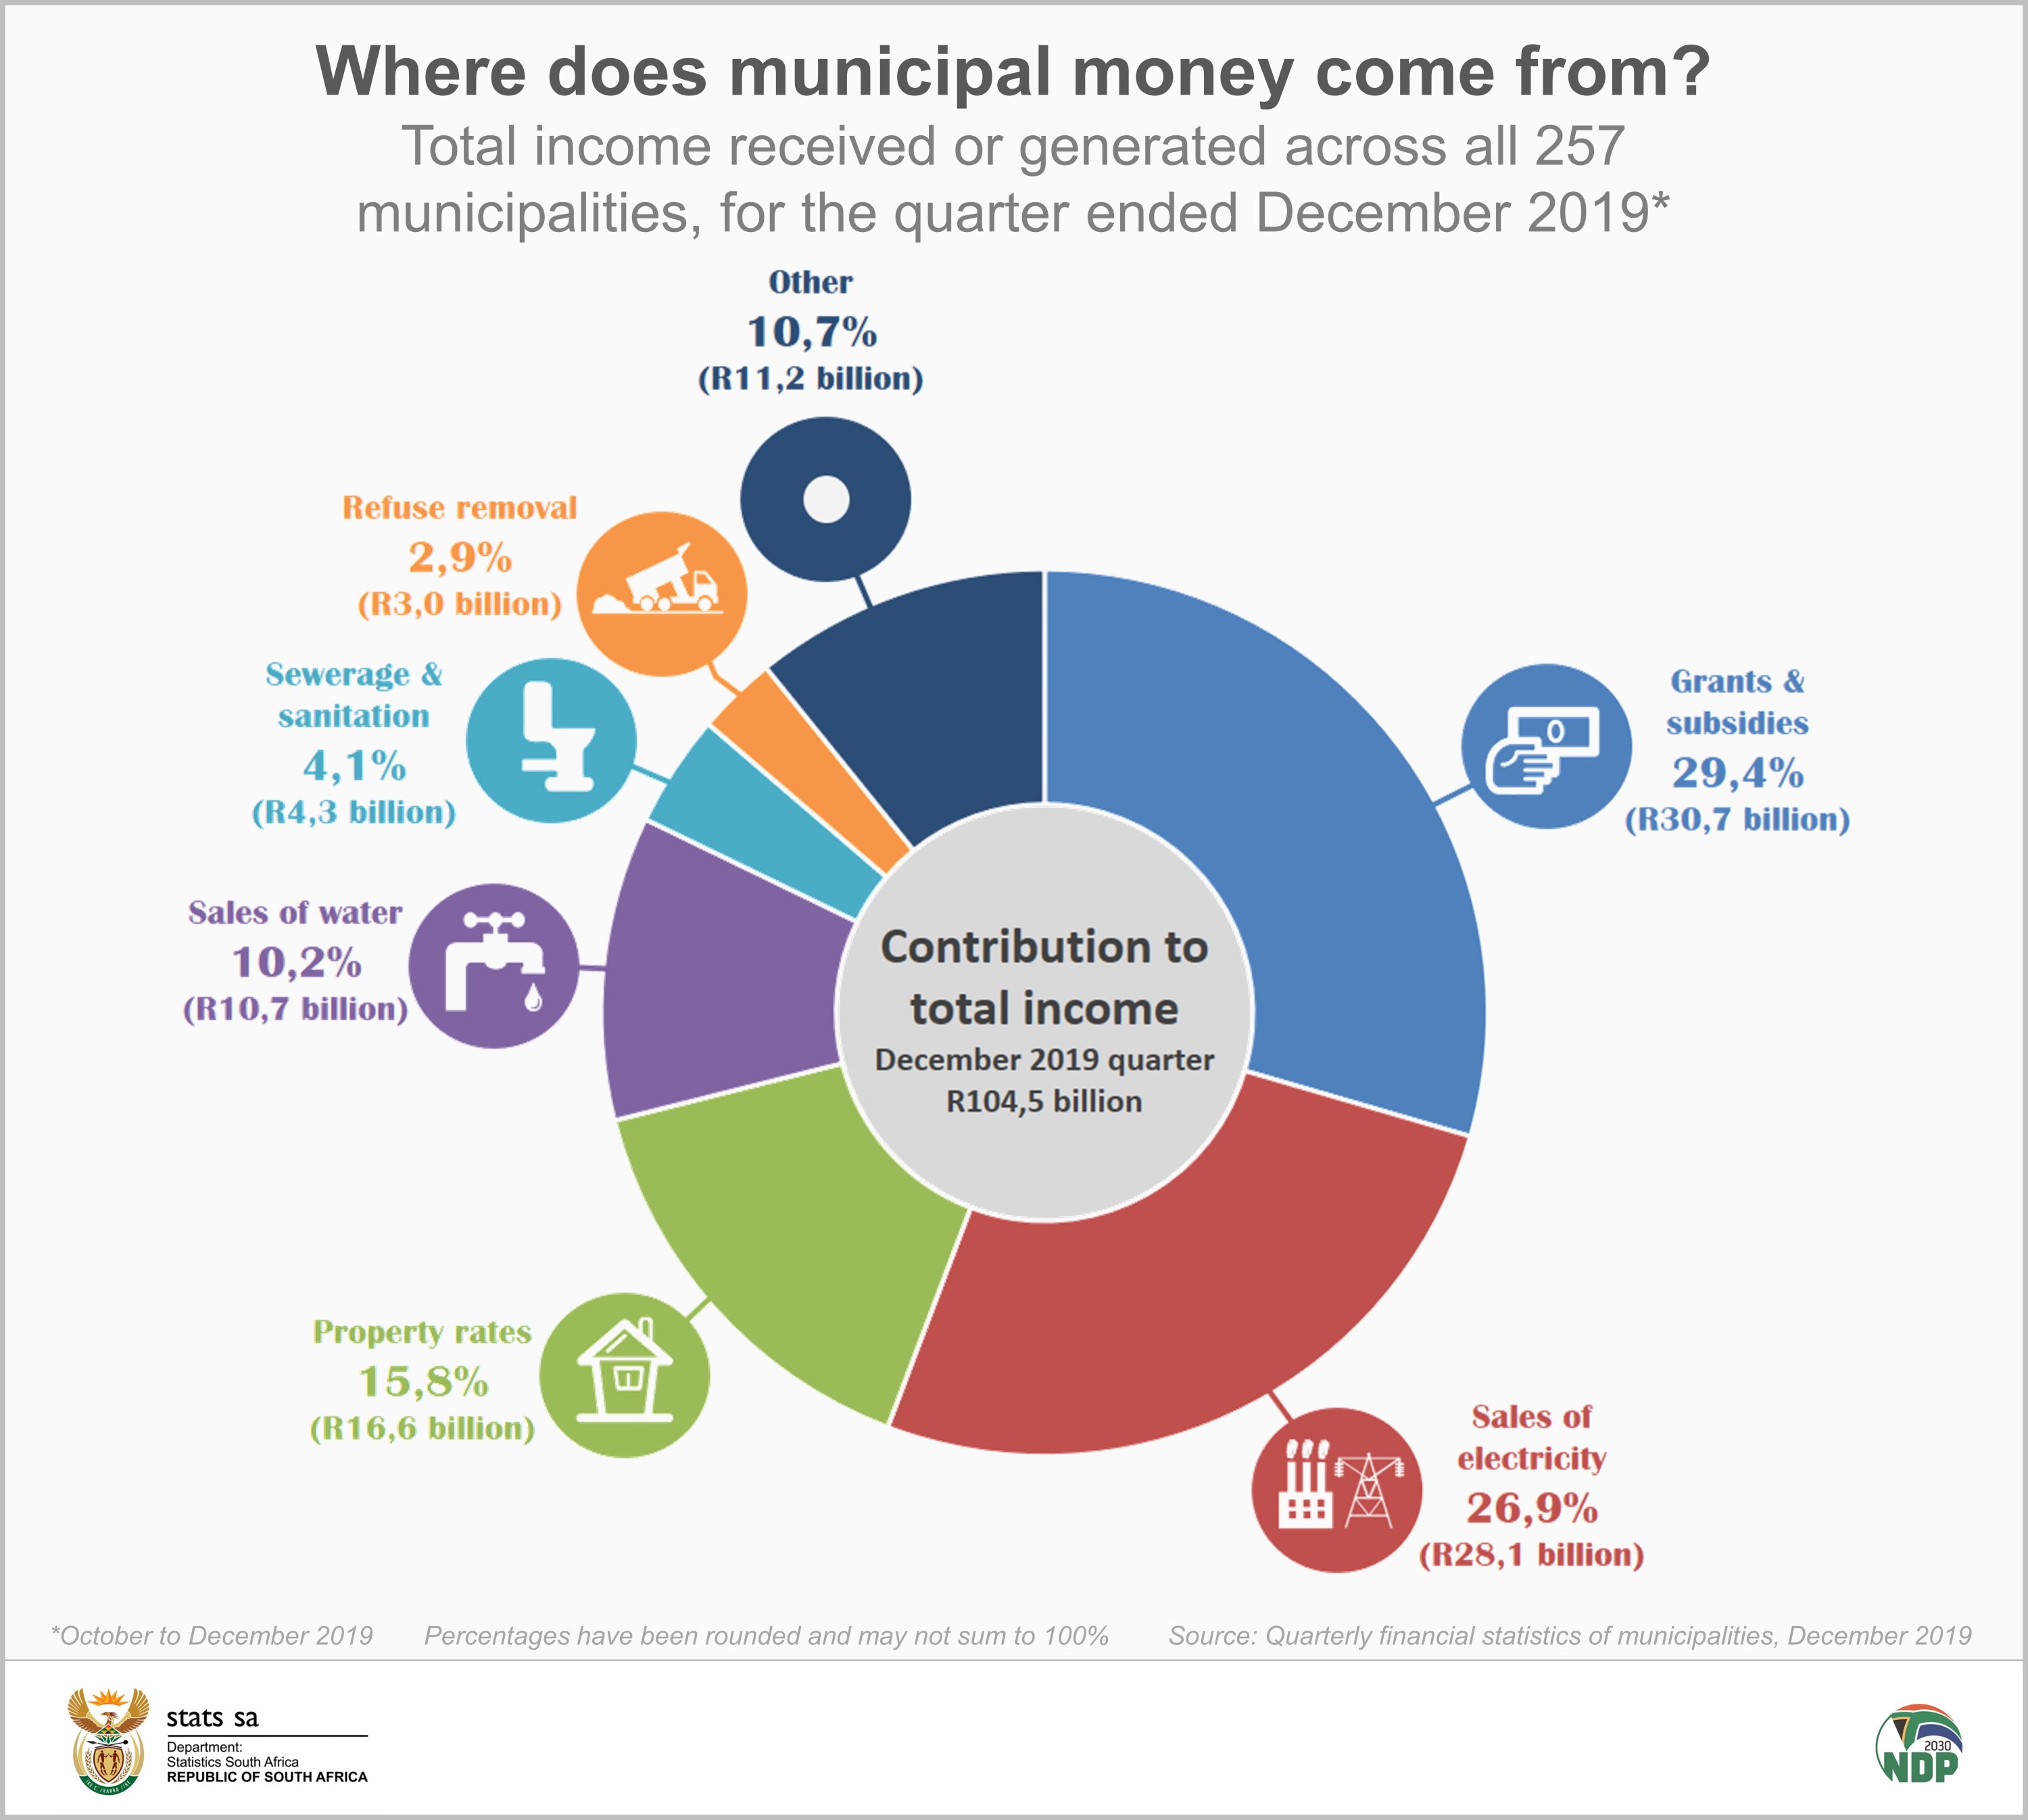
On the income side, municipalities received R104,5 billion in the quarter ended December 2019. Sales of electricity contributed 26,9% to total income.
To finance constitutionally authorised responsibilities, municipalities rely on two main sources of revenue: own-generated revenue and intergovernmental fiscal transfers (referred to as government grants and subsidies).
Regarding own revenue generation, the Constitution allows municipalities to make use of a variety of fiscal instruments, including service (user) charges for those services that municipalities render, property rates, and other local taxes.
Municipalities sourced R16,6 billion in the form of property rates.
Due to economic disparities across the South African landscape, most municipalities (especially those that are rural based) do not have enough capacity to generate their own revenue. Grants and subsidies bridge this fiscal gap by ensuring that all municipalities have enough funds to fulfil the mandate of service delivery.
Grants and subsidies accounted for 29,4% of total income.
The fourth biggest source of income was sales of water (10,2%), followed by sewerage and sanitation services (4,1%).
For more information, download the latest Quarterly financial statistics of municipalities report here.
1 Municipal operating expenditure is the total of all periodic expenses that are incurred by municipalities for the provision of basic services.
2 Employee-related costs serve as an input to efficient running of the municipal administration as well as the provision of essential services.
Similar articles are available on the Stats SA website and can be accessed here.
For a monthly overview of economic indicators and infographics, catch the latest edition of the Stats Biz newsletter here.