HOW UNEQUAL IS SOUTH AFRICA?
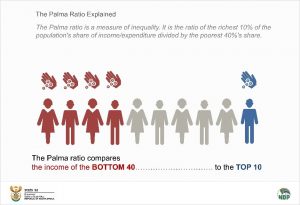
South Africa is known as one of the most unequal countries in the world, reporting a per-capita expenditure Gini coefficient of 0,67 in 2006, dropping to 0,65 in 2015. This is according to the Inequality Trends in South Africa report released by Stats SA. According to the Palma ratio, the top 10% of the population spent 8,6 times more than the bottom 40% in 2006; this ratio reduced to 7,9 in 2015. These figures indicate that overall inequality, measured at a national level, has declined between 2006 and 2015.
FOUR FACTS ABOUT INEQUALITY IN SOUTH AFRICA
1. The South African labour market is heavily racialised and gender-biased
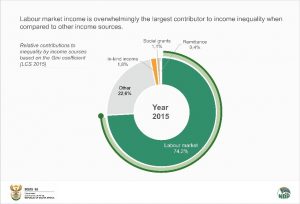
The largest contributor to overall income inequality came from the labour market at 74,2%.
Female workers earn approximately 30% less, on average, than male workers. The report reveals that males are more likely to be employed and have relatively better-paying jobs compared to females.
The earnings distributions starkly depict the heavily racialised inequality in the South African labour market. In addition to having the worst employment outcomes, black Africans also earn the lowest wages when they are employed. Whites, in contrast, earn substantially higher wages than all the other population groups. To put things into perspective, the mean real earnings between 2011 and 2015 amongst employed black Africans was R6 899 (real earnings) per month. For coloureds and Indians/Asians, the corresponding figures are R9 339 and R14 235 per month, respectively. Amongst whites, it was R24 646 per month, or more than three times as high as it was amongst black Africans.
2. Eastern Cape was the most unequal province in 2015
The Eastern Cape reported the highest levels of inequality in 2015, with the Western Cape and Mpumalanga coming in second. All provinces, except Limpopo and Eastern Cape, experienced a decline in inequality from 2006 to 2015.
The differences in annual mean and median expenditures by province show the reality of interprovincial inequality. Gauteng and Western Cape were better off when compared to other provinces, as illustrated by their higher annual mean and median expenditures. Individuals living in Limpopo and Eastern Cape had the lowest annual mean and median expenditures for all four data points.
3. The bottom 60% of households depend more on social grants and less on income from the labour market
Since 2006, there has been a greater dependence on social grants and less reliance on income from the labour market in the bottom deciles. In contrast, there was greater reliance on income from the labour market in the top deciles.
While labour market income is overwhelmingly the largest contributor to income inequality when compared to other income sources, social grants and remittances have played a crucial role in reducing the income inequality gap between the bottom and top deciles over the years in South Africa.
4. Black Africans reported the largest increase in the average number of assets owned
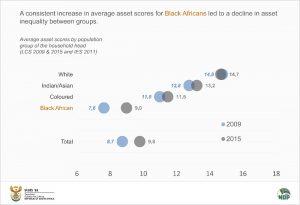
A consistent increase in average asset scores for black Africans led to a decline in asset inequality between groups. Despite this increase, within-group asset inequality for black Africans has increased.
For more information, download the Inequality Trends in South Africa report here.


