
Working capital: how do South African businesses fare?
Stats SA provides a snapshot of working capital across the formal business sector in the latest release of the Annual Financial Statistics (AFS) report. Working capital is a measure of a company’s liquidity and is one of a number of measures that provide insight into a company’s ability to pay off debt.
To calculate working capital, simply subtract a company’s current liabilities from its current assets. Current assets are those assets that can be easily liquidated within a period of a single financial year, such as cash and inventory. Current liabilities include any debt that needs to be settled within a year, such as creditors and short-term loans.
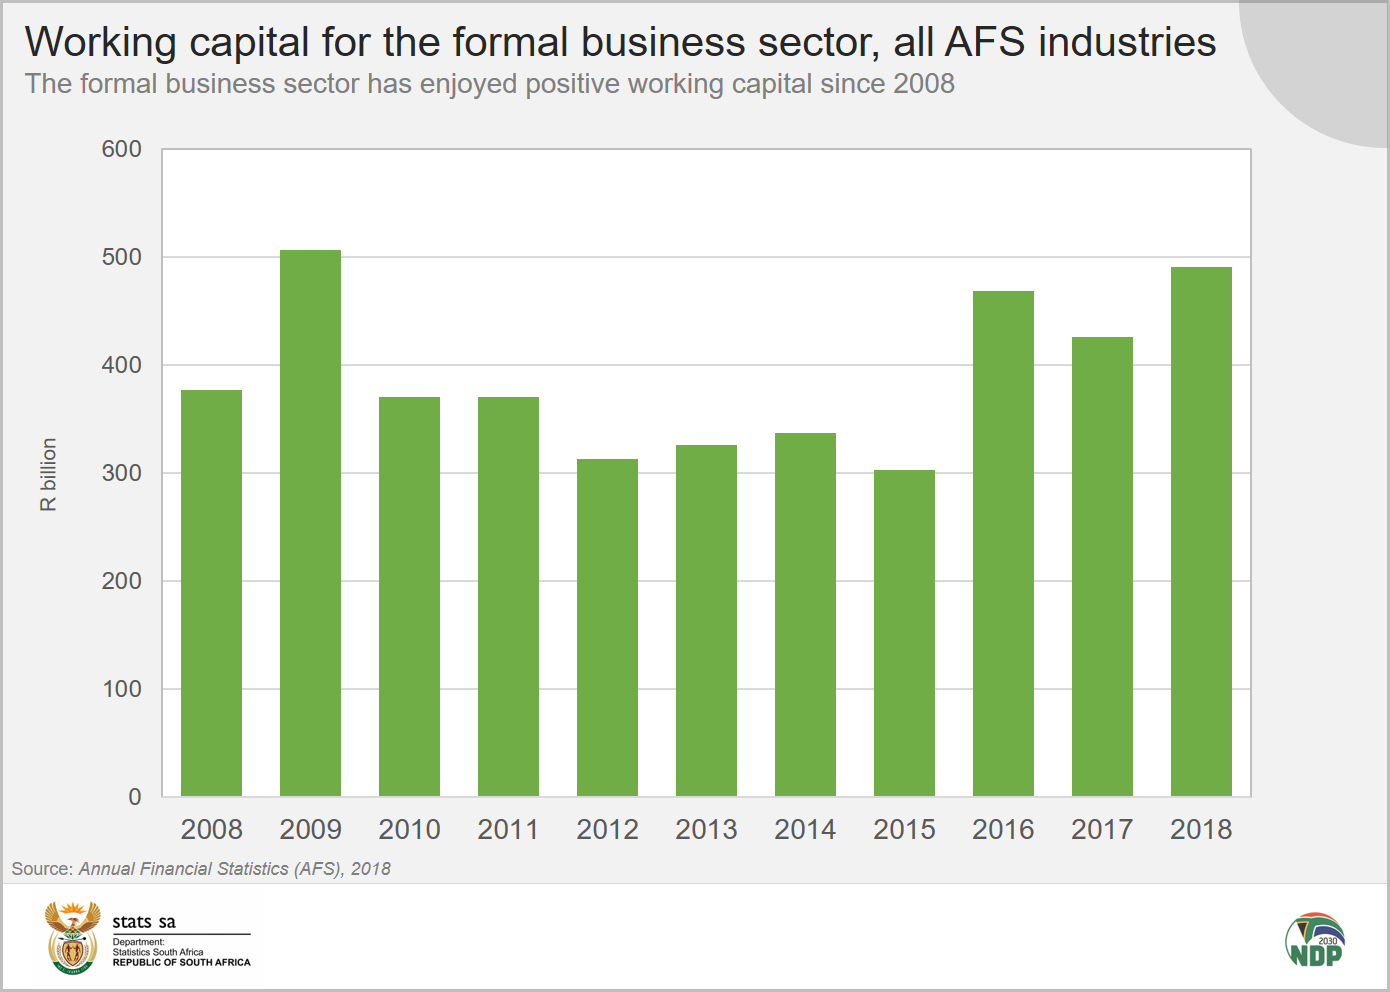
The South African formal business sector1 reported a total of R3,8 trillion in current assets and R3,3 trillion in current liabilities in 2018. Subtracting current liabilities from current assets, working capital for all industries comes to a positive R491 billion. Note that these results are based on the AFS survey, which excludes agriculture and hunting; government and educational institutions; and financial intermediation, insurance and business services ‘not elsewhere classified’.
Positive working capital indicates a business that has the ability to settle short-term obligations as well as the potential to grow and invest funds. Negative working capital may be a warning sign that a business could face difficulty in paying back short-term debt.
The formal business sector as a whole has enjoyed positive working capital over the last decade. The year with the lowest reading was 2015 when total working capital was R303 billion (click on the image to enlarge).
Of course, working capital is one of many financial measures that are available. To get a fully informed picture of financial health, the business analyst should consider a range of indicators. Table 11 in the AFS report outlines a number of financial ratios for industries in the formal business sector.
Even though the sum of the formal business sector is in positive territory in terms of working capital, some industries are better off than others. Below is a breakdown of working capital by industry.
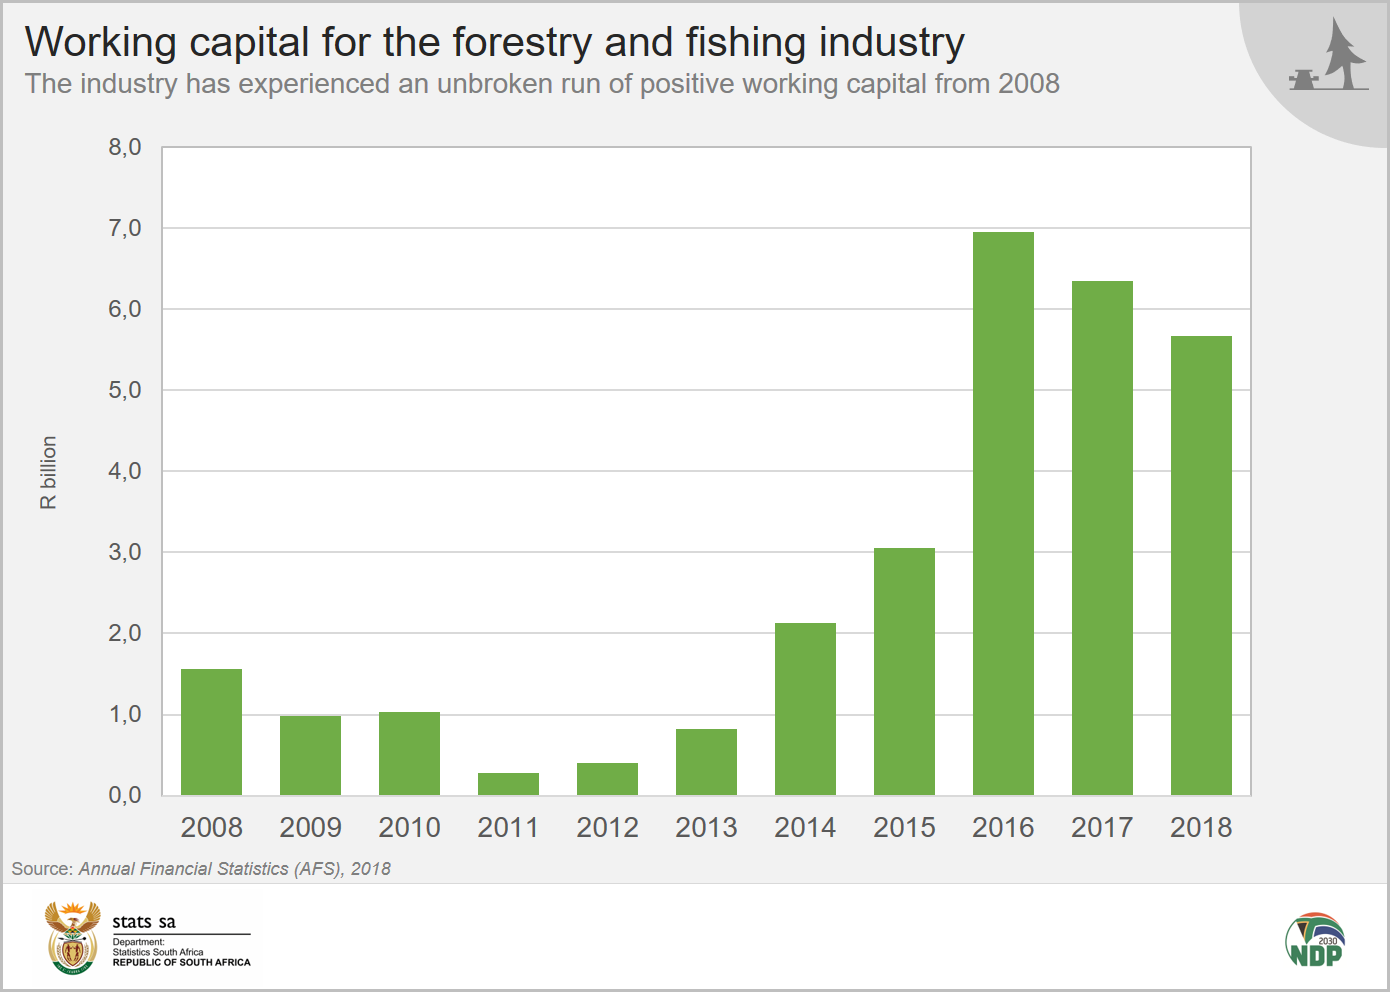
Forestry and fishing has had an unbroken run of positive working capital from 2008. The highest reading for this industry was in 2016 at R6,9 billion, decreasing to R6,3 billion in 2017 and further to R5,7 billion in 2018. A fall in working capital might indicate a rise in current liabilities. It might also indicate that businesses are reducing their current assets. Current assets can be used, for example, to grow the business.
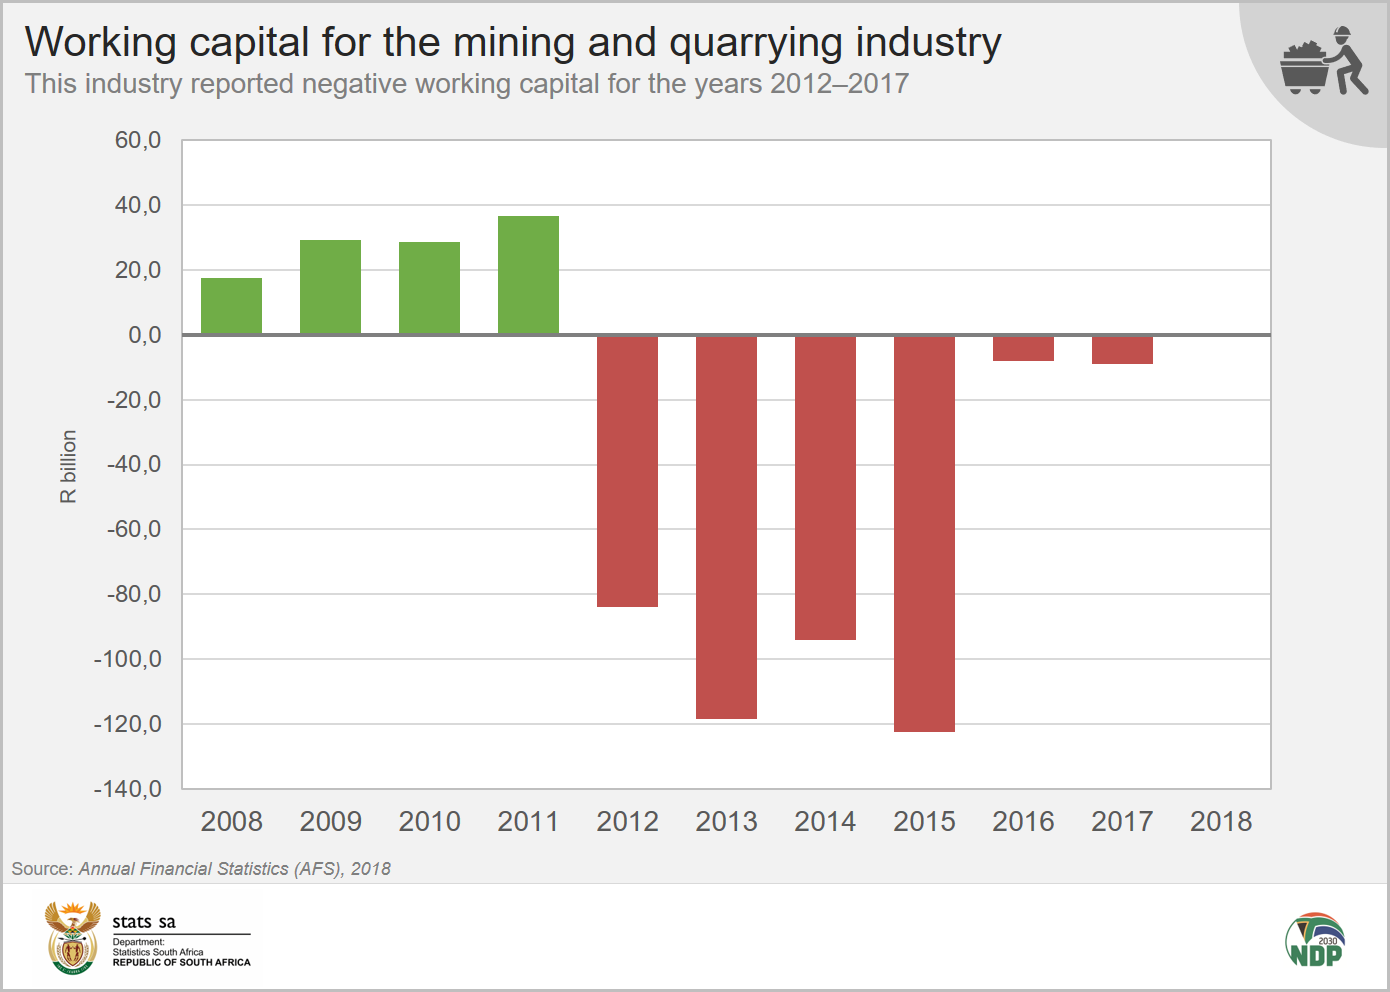
The mining and quarrying industry shows a completely different picture. This industry recorded negative working capital between 2012 and 2017, reaching -R122 billion in 2015. This was mainly the result of a rapid rise in current liabilities over that period. A slight positive working capital was reported in 2018, amounting to R618 million.
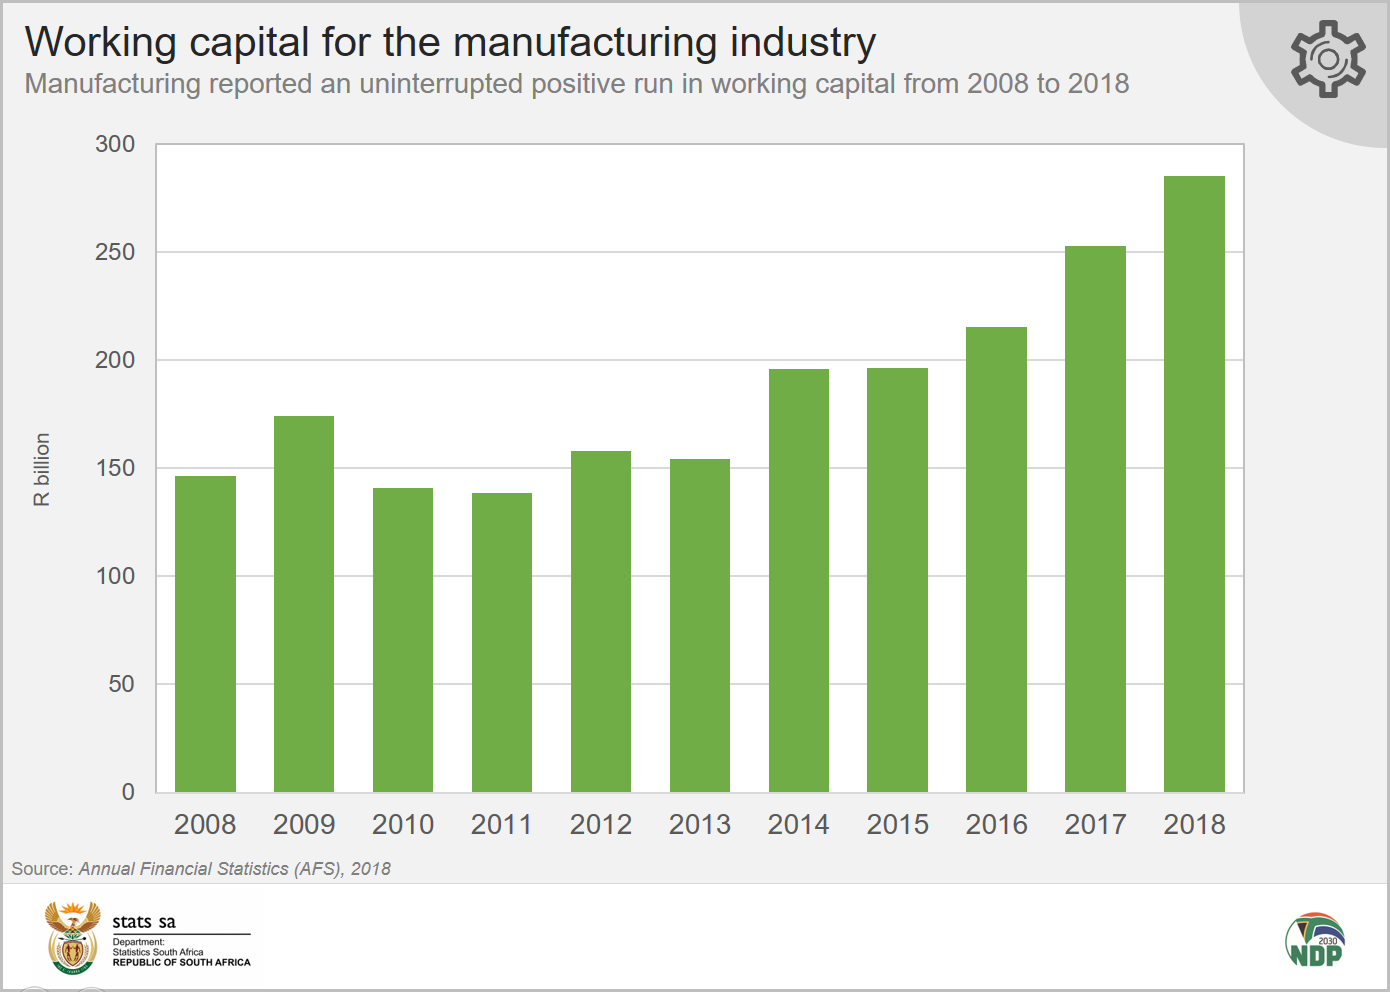
Manufacturing reported an uninterrupted positive run in working capital from 2008 to 2018, with the highest reading of R285 billion in 2018. Of course, manufacturers often have large inventories on hand, mostly of raw materials. This tends to push up the size of current assets on the balance sheet.
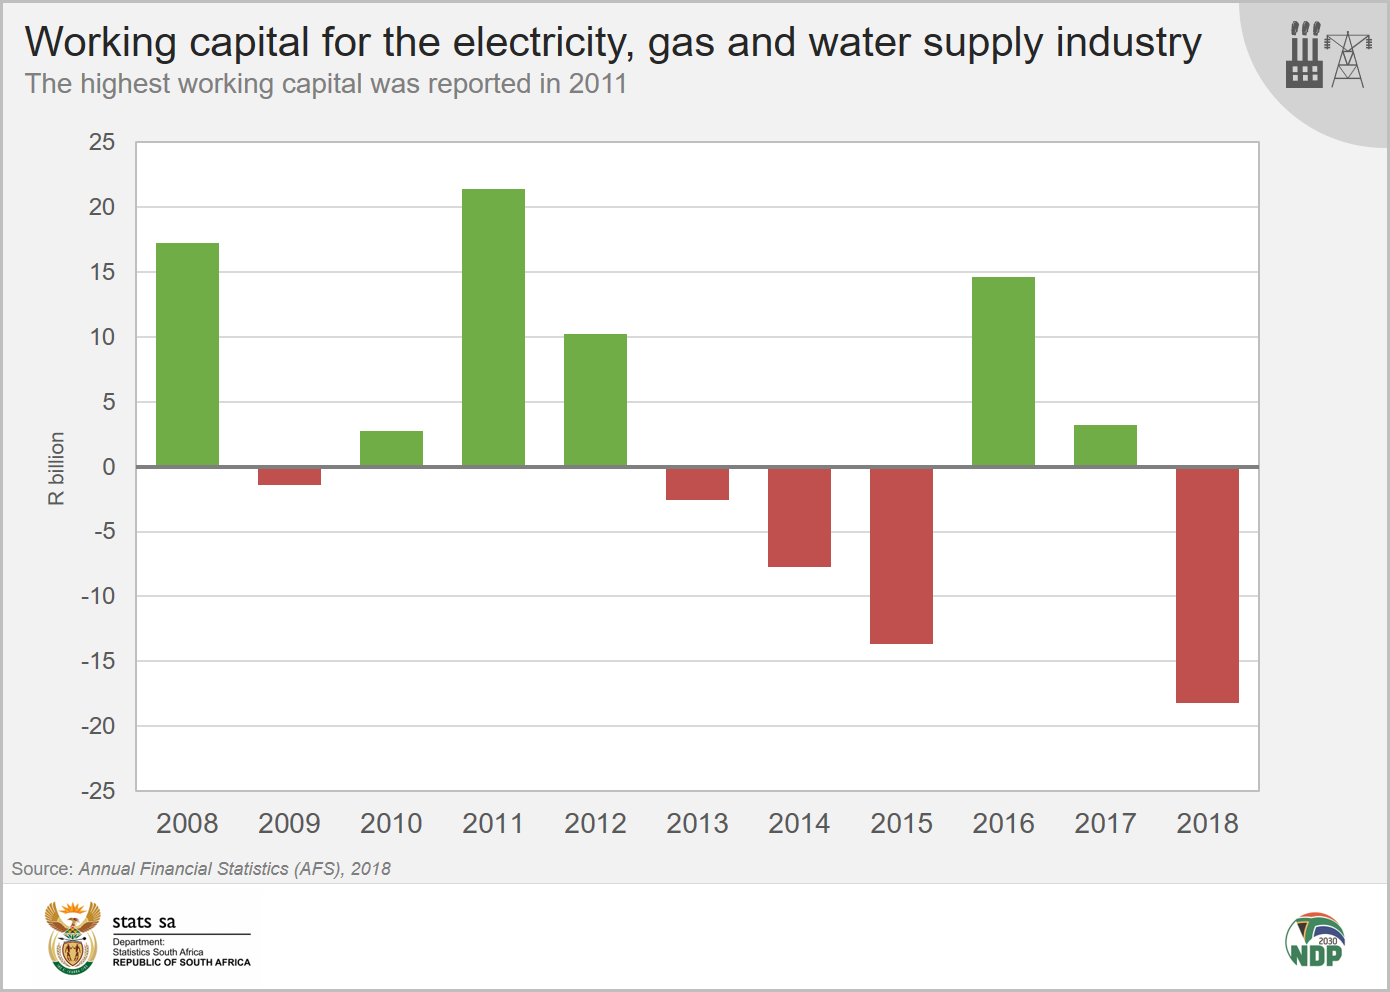
Working capital for the electricity, gas and water supply industry varied from positive to negative throughout 2008 to 2018. The highest working capital reported was in 2011 (R21 billion) and the lowest in 2018 (-R18 billion).
The construction industry reported positive working capital from 2008 to 2016. Negative working capital was reflected in 2017 (-R12 billion) and 2018 (-R21 billion). This was the result of a rapid rise in current liabilities and a decrease in current assets.
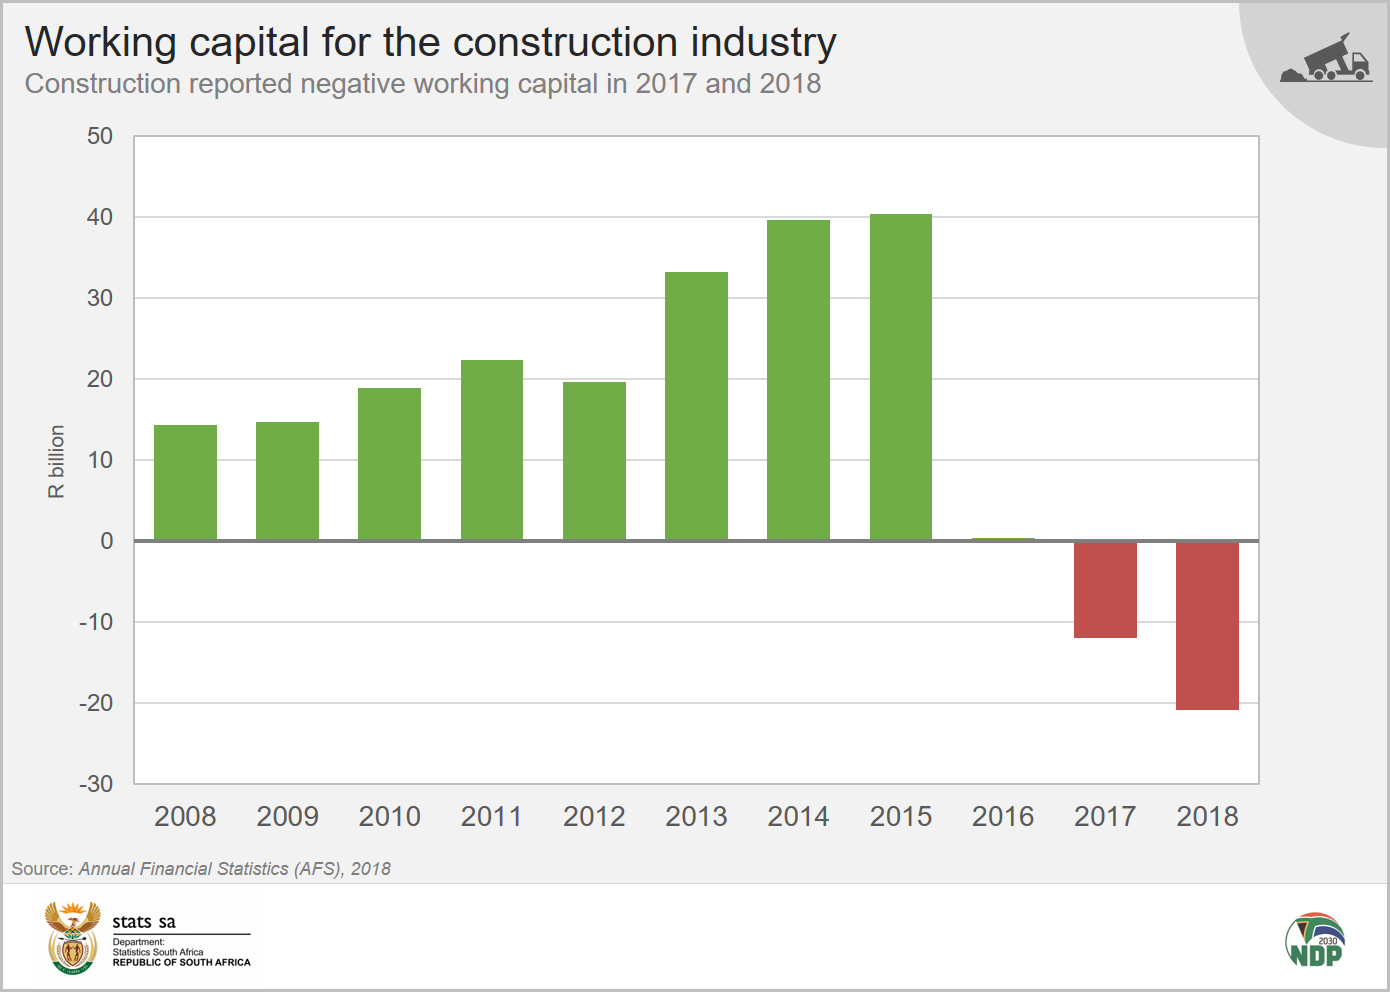
This mirrors figures from the latest gross domestic product (GDP) report that shows how the construction industry struggled since 2017. Construction recorded negative growth in both 2017 and 2018.2
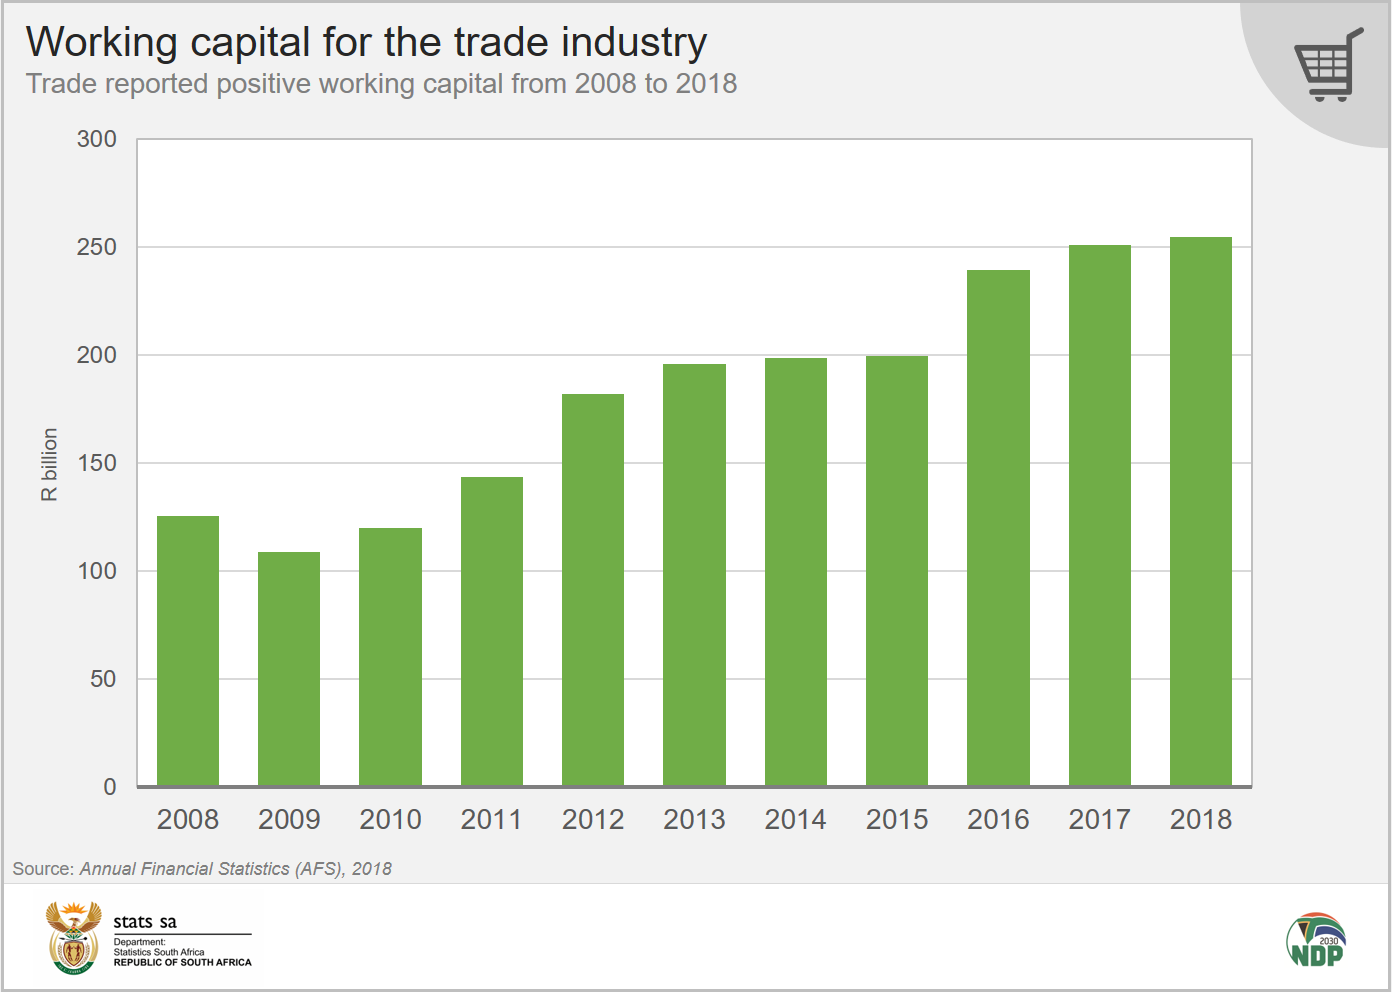
The trade industry reported positive working capital for all years from 2008 to 2018. The highest working capital was reported in 2018 (R254 billion). Like manufacturers, traders also tend to have large inventories on hand, which tends to push up current assets.
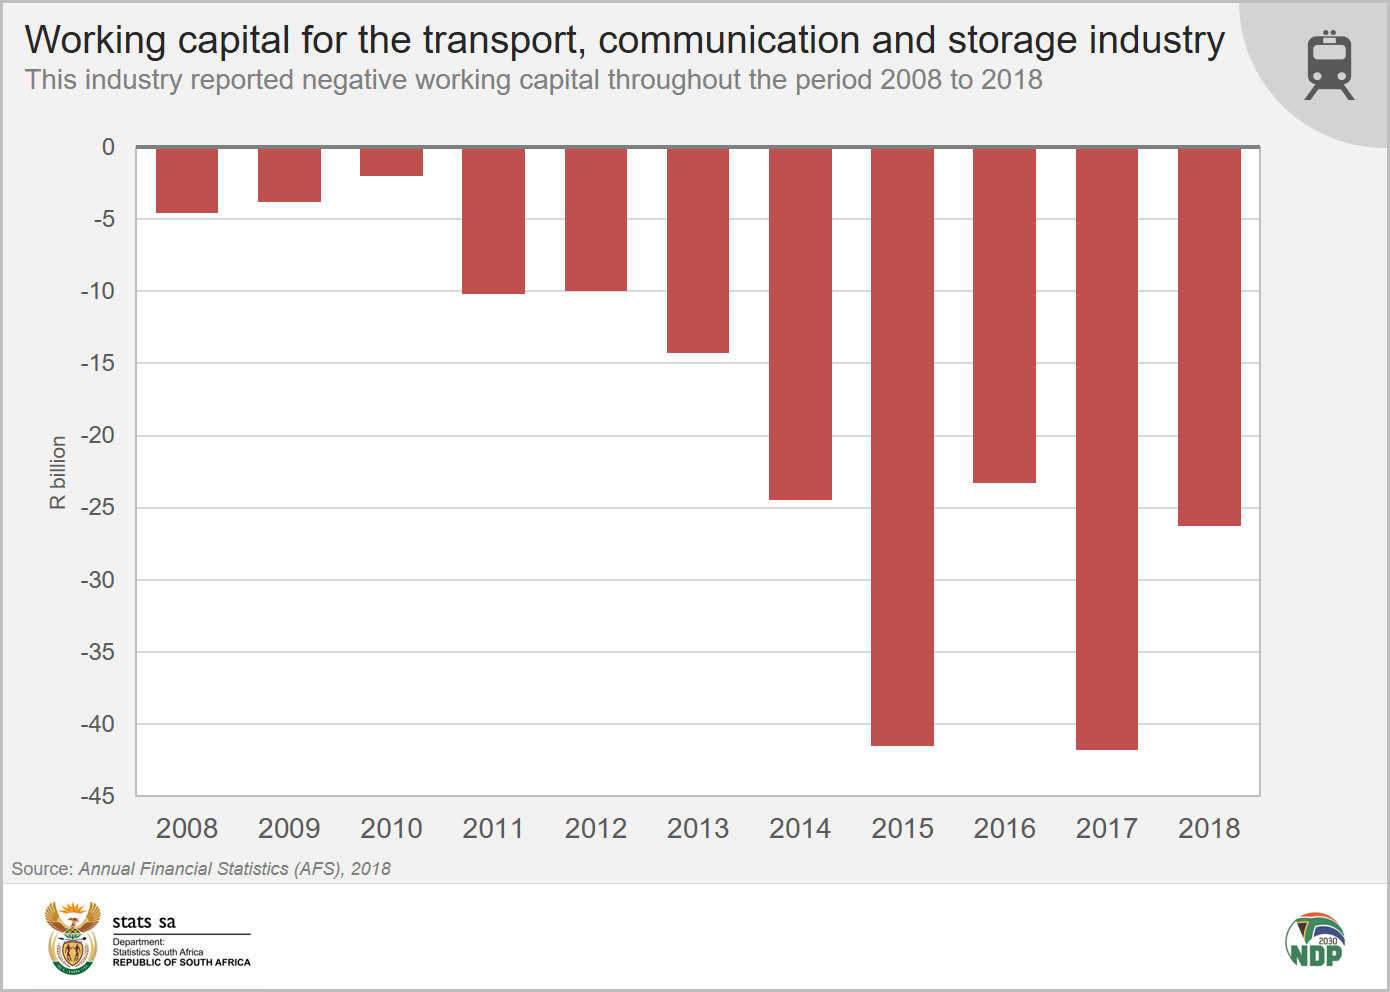
Transport, communication and storage is the only industry that reflected negative working capital throughout the period 2008 to 2018. The lowest working capital was reported in 2017 (-R42 billion). The negative working capital reported in the industry is the result of large current liabilites reported in railway transport, air transport and telecommunications.
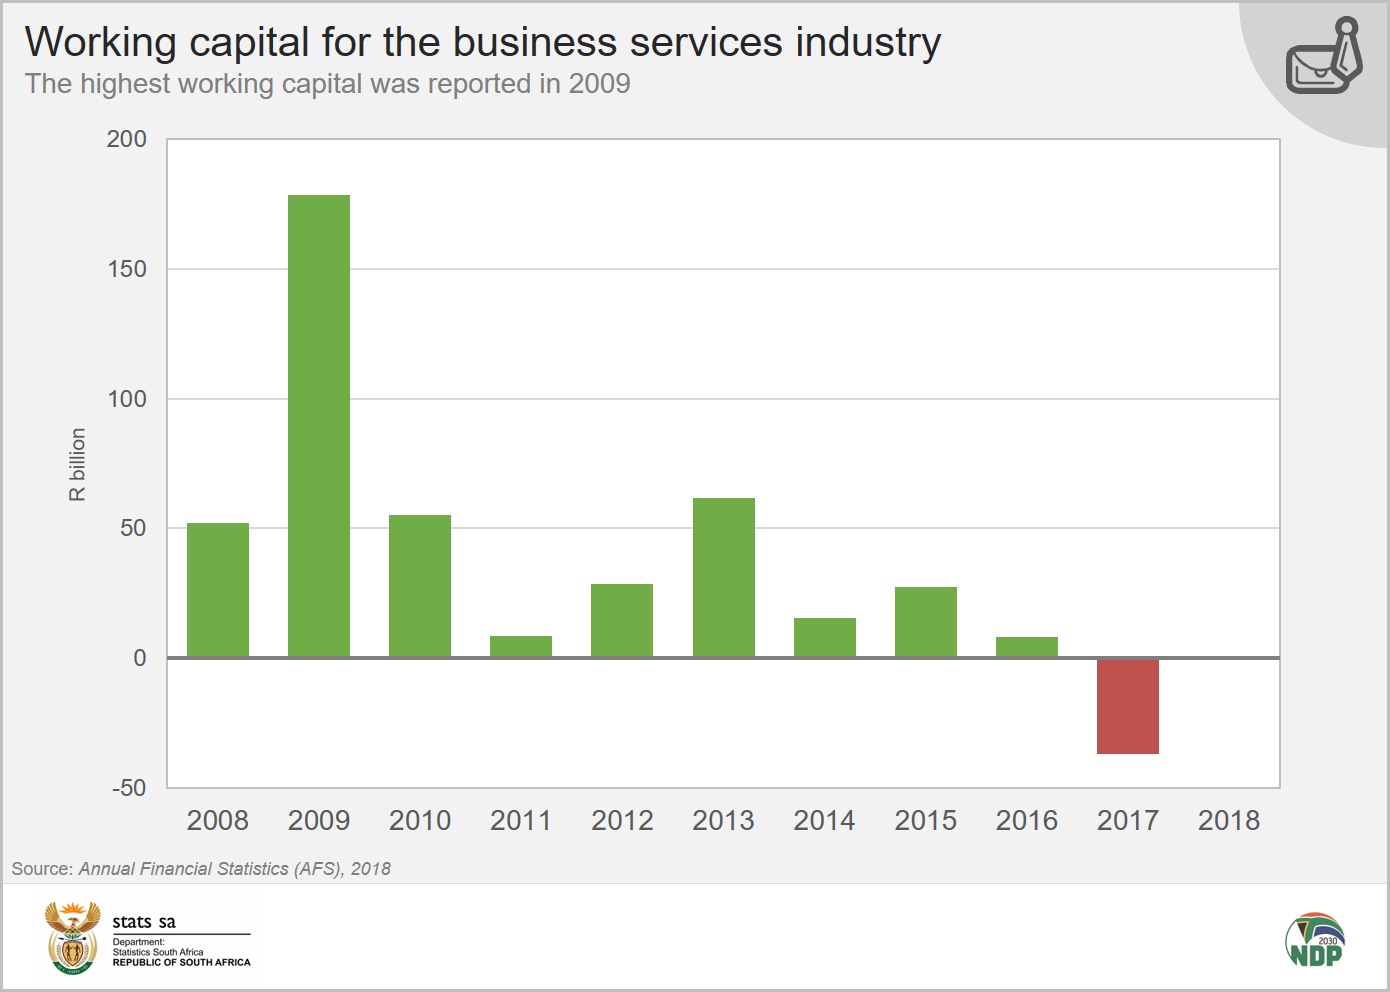
The business services industry reported negative working capital in 2017 (-R37 billion), with a slight positive reading in 2018 (R869 million). The highest working capital was reported in 2009 (R178 billion).
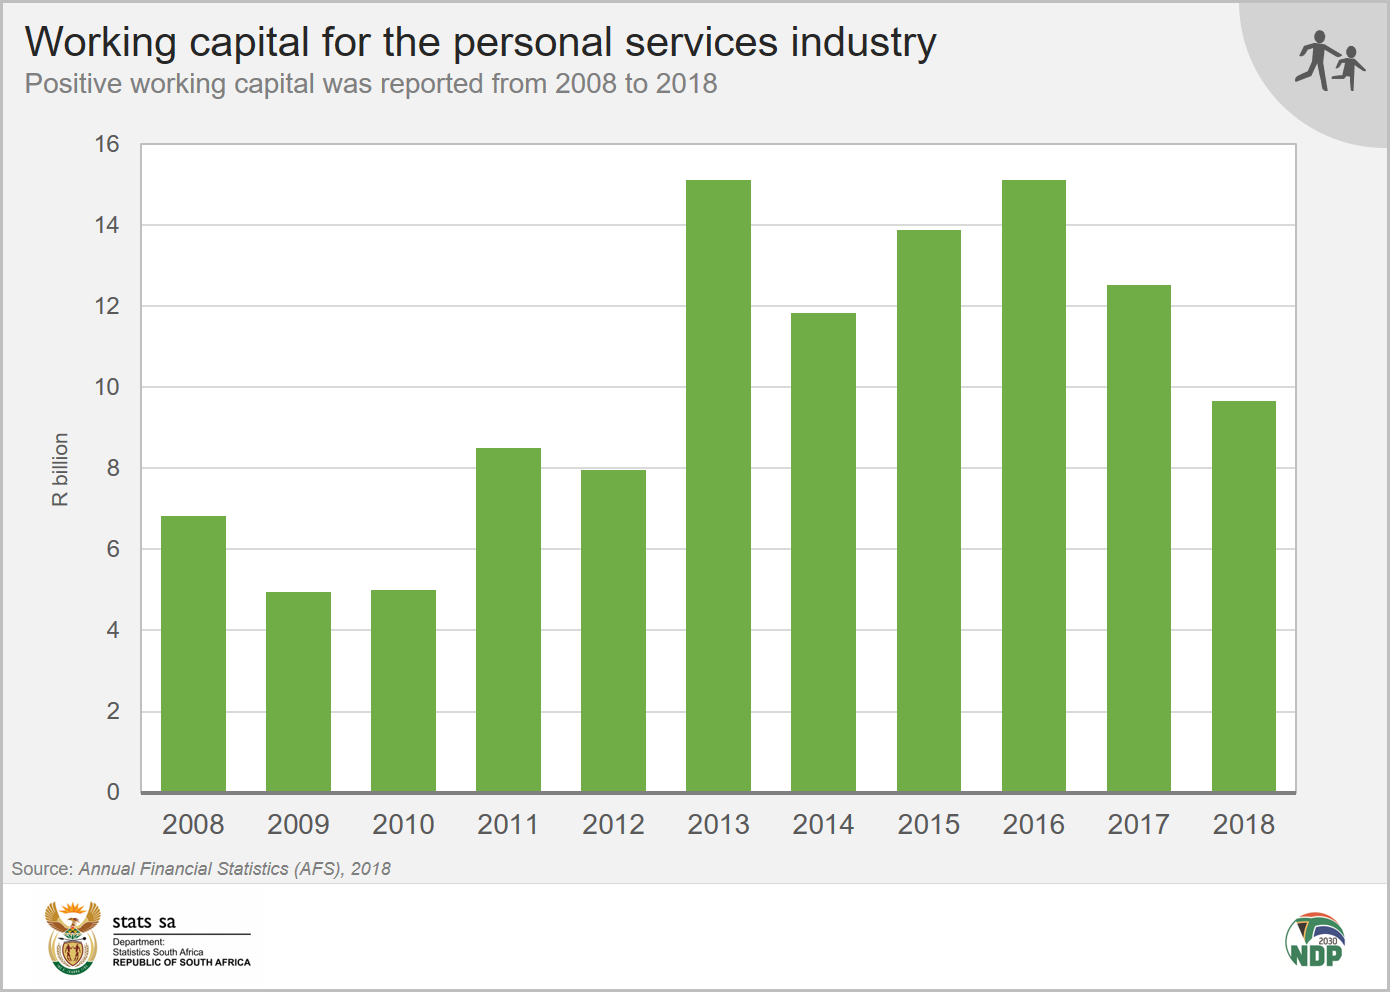
The personal services industry reported positive working capital for all years from 2008 to 2018, with the highest reported in 2013 (R15 billion).
To summarise, the manufacturing, forestry and fishing, trade and personal services industries have posted consistent positive working capital figures over the last decade. Transport, on the other hand, has found itself in negative territory.
Download the latest Annual Financial Statistics (AFS) report here. The AFS survey measures the financial health and performance of each industry, including information on turnover, purchases, and capital expenditure. The report sources data from the financial statements of enterprises (i.e. private businesses and public corporations).
1 The AFS excludes agriculture and hunting; government and educational institutions; and financial intermediation, insurance and business services ‘not elsewhere classified’.
2 Stats SA, Gross Domestic Product (GDP), 2nd Quarter 2019 (download here).
Similar articles are available on the Stats SA website and can be accessed here.
For a monthly overview of economic indicators and infographics, catch the latest edition of the Stats Biz newsletter here.