Public-sector capital expenditure continues to fall
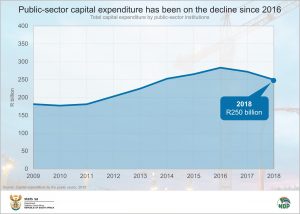
Public-sector investment in the nation’s infrastructure slowed for a second consecutive year, falling by 8,2% in 2018. This followed a 4,0% decline in 2017. These decreases have seen public-sector capital expenditure slip to a level last seen in 2014.
Capital expenditure is money that institutions spend to buy, maintain or upgrade fixed assets such as buildings, vehicles, land and equipment. It is the brick and mortar type of investment that forms the backbone on which the economy functions. Capital investment improves logistics, education, connectivity, facilitates trade and attracts investment. It also allows communities to access a range of services such as water, electricity and sanitation.
South Africa’s 757 public-sector institutions spent R250 billion on fixed assets in 2018. This is lower than the amounts registered in 2017 (R272 billion) and 2016 (R283 billion), according to the recently published Capital expenditure by the public sector report. This is comparable to the capital expenditure of R252 billion in 2014 (click on the image to enlarge).
Public-sector institutions include national and provincial government departments, municipalities, extra-budgetary accounts and funds, public corporations, and higher education institutions.
A sharp slowdown in investment related to construction activities underpinned the decline in 2018. Spending on new construction works fell by 11,3%, from R182 billion in 2017 to R161 billion in 2018. Eskom was the major contributor, cutting its own construction spending by R10 billion, followed by Telkom (by R3 billion).
The Gauteng Department of Education, the KwaZulu-Natal Department of Education and the National Department of Water Affairs also reduced construction spending, each by approximately R2 billion.
The entire public sector cut back spending on plant, machinery and equipment by 2,5%. However, spending on land and existing buildings increased by 16,0% in 2018. Expenditure on transport equipment was up by 14,0%. The positive showing by these two smaller asset types was not enough to halt the slowdown in overall capital expenditure.
The drop-off in capital expenditure mirrors the recent woes experienced in the construction industry. The industry has been struggling since early 2017 and has been in recession, according to the gross domestic product (GDP) results for the second quarter of 2019.1
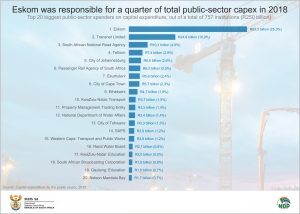
Eskom remains the single largest contributor to total public sector capital expenditure, even after reducing spending in 2018. South Africa’s largest power producer was responsible for just over a quarter (R63 billion) of the R250 billion public sector capital-spend. This amount was mainly focused on the power generation projects at Kusile, new electricity distribution programmes, and vehicle build programmes.
Transnet was the other heavyweight, incurring capital expenditure of just under R25 billion (10,0%). This was on new wagons for freight rail and various other types of equipment.
The South African National Roads Agency (SANRAL) was the third biggest spender on fixed assets in 2018, contributing 4,0% to the public-sector capital expenditure pie. SANRAL focused its spending on improving road infrastructure, which includes work done on the R573 Moloto Road.
Telkom spent R7,4 billion, mostly on the expansion of its existing mobile network and the next-generation network project.
Johannesburg, the most populous municipality in the country, focused the bulk of its capital expenditure on the construction of a park-and-ride facility in Greenside, the purchasing of air lifting equipment, and the development of a new community centre in Matholesville.
The Passenger Rail Agency of South Africa incurred capital expenditure of R6,2 billion. The greater portion of this (R5,1 billion) was incurred on acquiring new trains and replacing old and building new network lines.
For more information, download the Capital expenditure by the public sector, 2018 report, unit data and media presentation here.
1 Quarter-on-quarter, seasonally adjusted and annualised. Stats SA, Economy dodges recession as GDP climbs 3,1% (read here).
Similar articles are available on the Stats SA website and can be accessed here.
For a monthly overview of economic indicators and infographics, catch the latest edition of the Stats Biz newsletter here.


