
Tertiary education’s salary bill
South Africa’s 26 higher education institutions spent R40 billion on compensation of employees in the 2018 financial year. That represents 61% of total spending1, according to the latest Financial statistics of higher education institutions report. This includes line items such as salaries and wages, pension benefits, medical aid, and bonuses.
Higher education spending has been in the spotlight in recent years. Many institutions implemented programmes to absorb staff previously employed by third-party contractors. This included the insourcing of catering, security and cleaning personnel.
Drilling down to the institutions themselves, the University of South Africa (Unisa) was the biggest spender on staff in 2018, committing just over R5 billion to compensation of employees. This represents 13% of the total salary bill for all higher education institutions. Of course, this does not necessarily mean that Unisa is the most generous institution when it comes to staff. Unisa also happens to be the largest higher education institution in the country, enrolling a third of the nation’s one million students2. A bigger burden often translates to more spending (click on the image to enlarge).
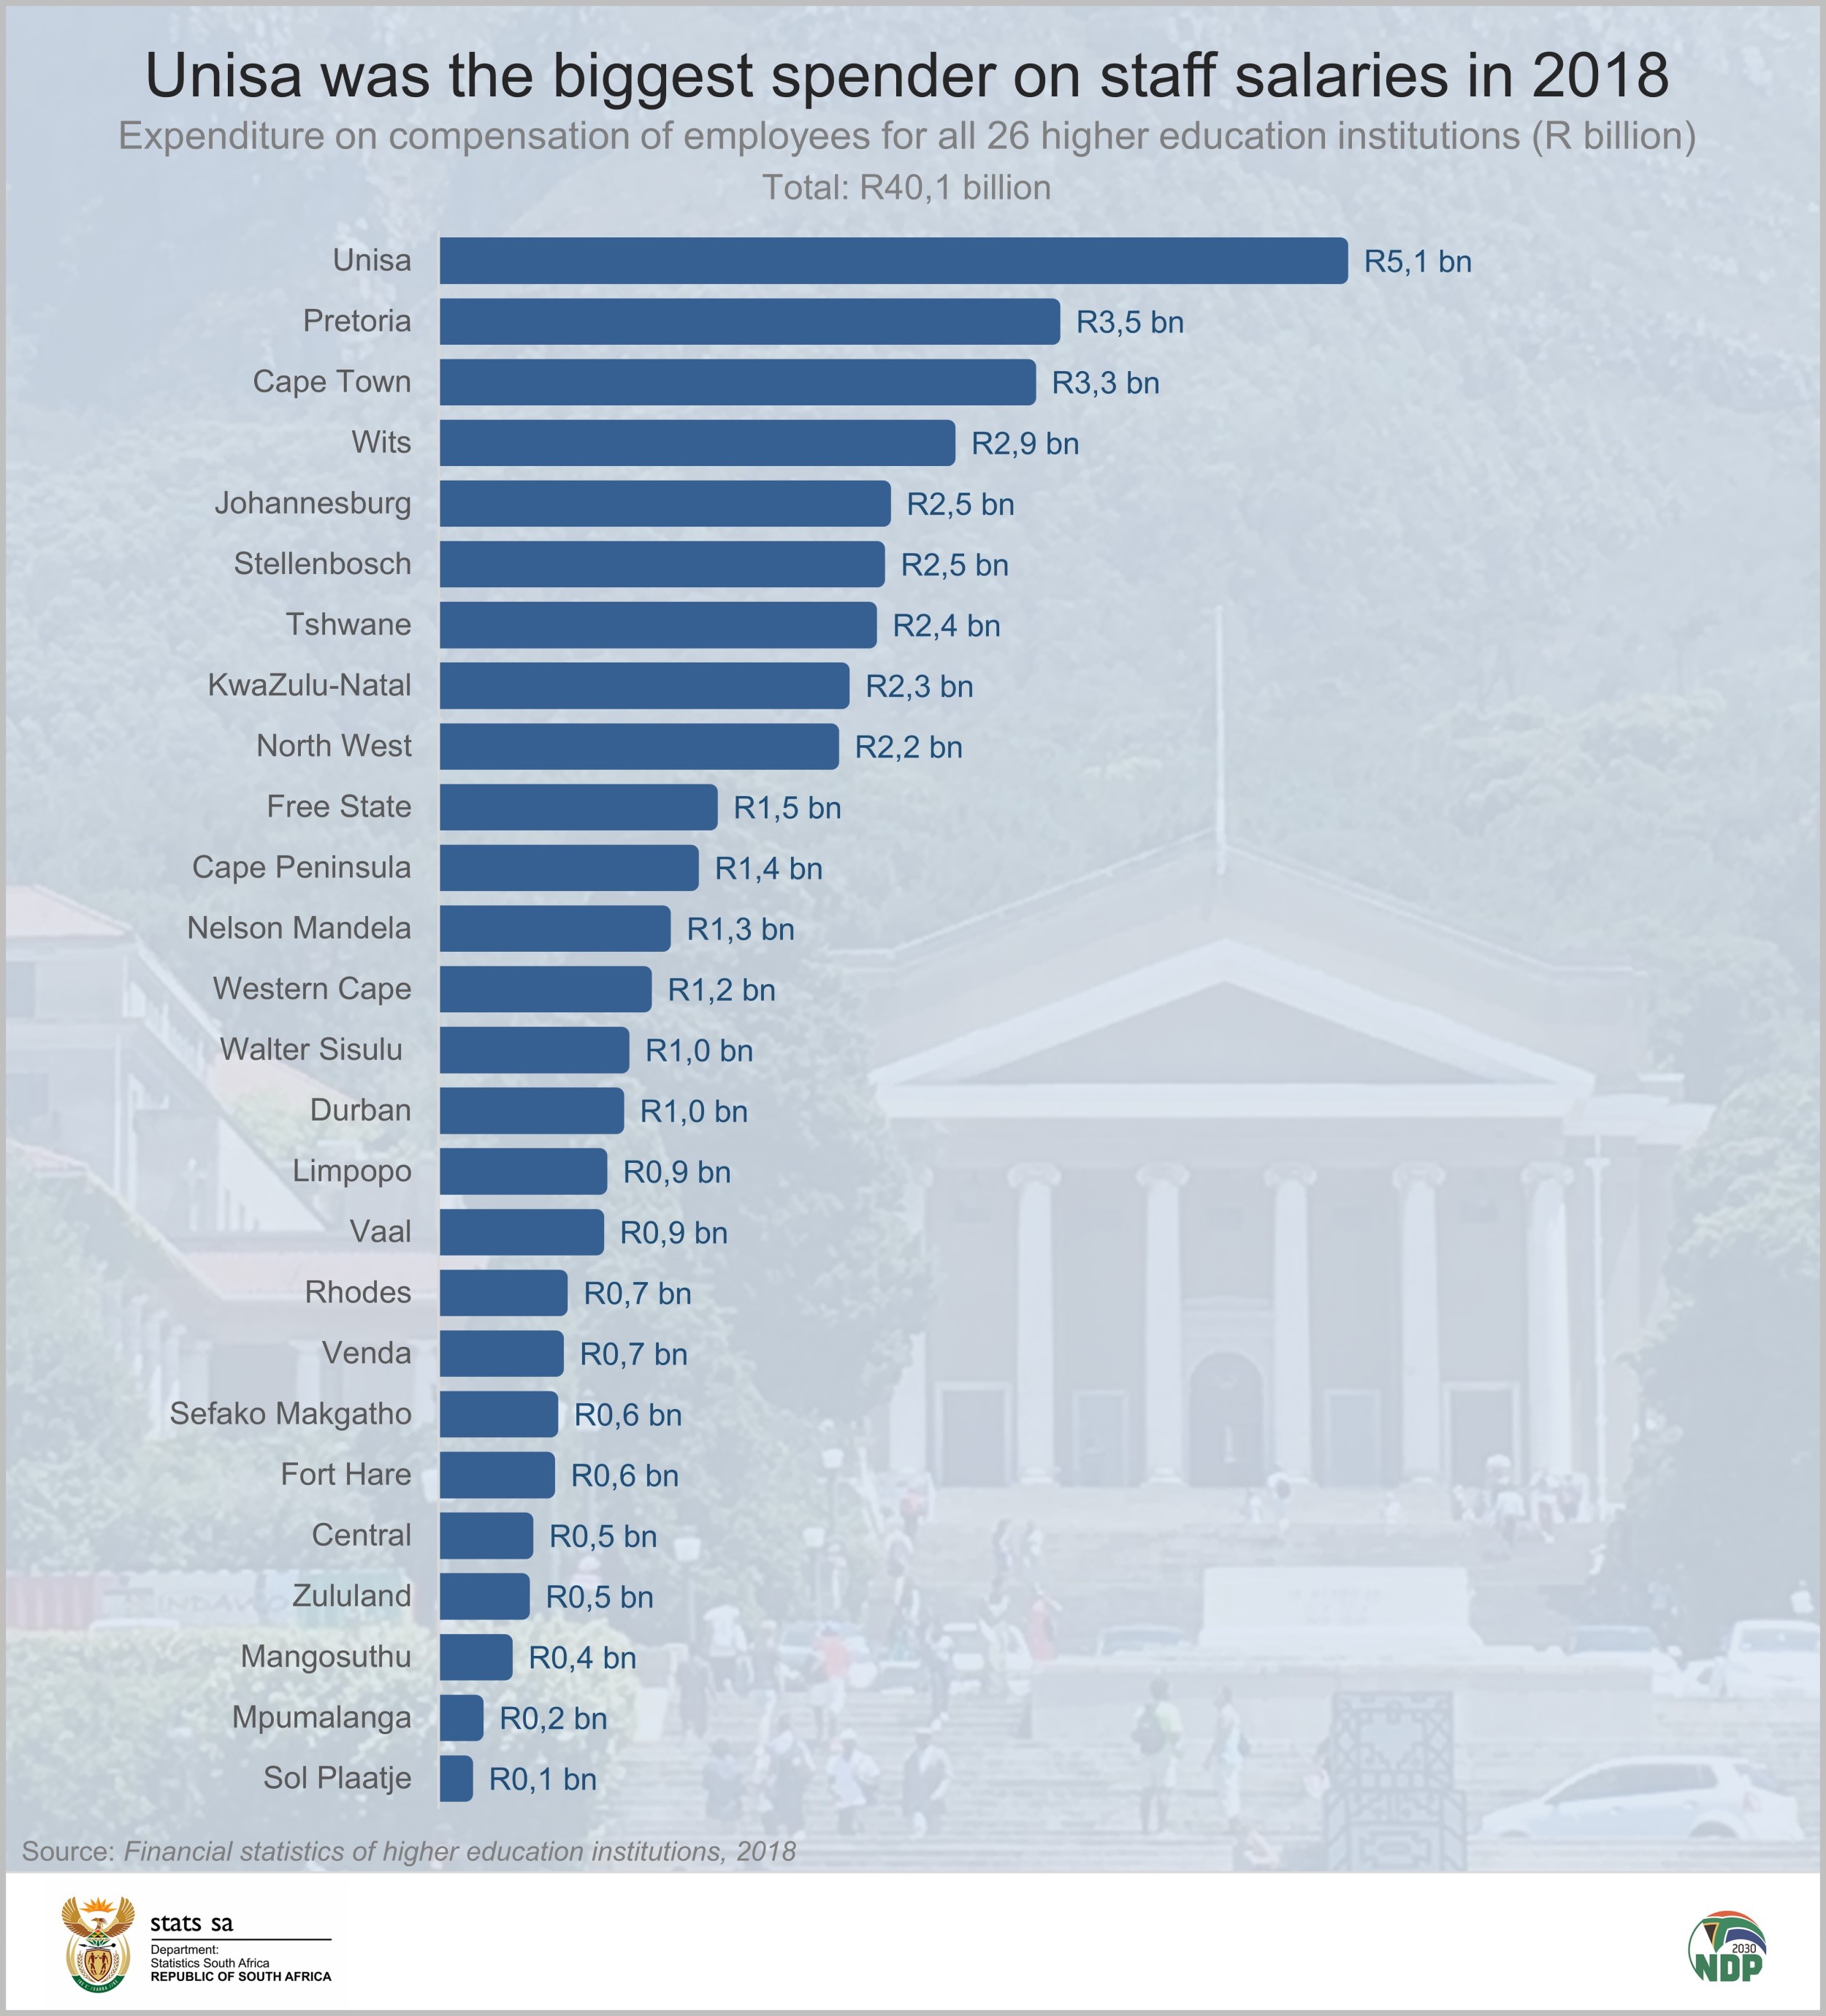
The University of Pretoria (UP) and the University of Cape Town (UCT) were the second and third biggest spenders, followed by the University of the Witwatersrand (Wits).
The picture shifts slightly when the salary data are represented as a percentage of total spending by each institution. Unisa is still on top, having spent 74% on compensation of employees and only 25% on goods and services in 2018. It is important to note that Unisa is the only distance-learning institution, making their cost structure quite different from others. The University of Limpopo was in second place with compensation of employees taking up 70% of total spending.

Mangosuthu University of Technology, located in Durban, made the lowest contribution to compensation of employees (48%), but the highest contribution toward purchases of goods and services (45%). A closer look at the data reveals that Mangosuthu increased its goods and services spending by 33%, from R263 million in 2017 to R350 million in 2018. The jump in spending was mainly due to the payment of operating leases for student accommodation.
Higher education institutions form part of the general government family, so how does all of this stack up against the rest of the state?
As mentioned above, the average spend on employees for all 26 institutions – as a percentage of total spending – was 61%. For the private sector, the figure is much lower. The formal business sector spent 14% of total expenditure on staff, according to data for the second quarter of 20183. Why is the proportion so much higher for higher education institutions? Apart from the fact that universities are very different from businesses, it’s important to note that universities require large numbers of highly educated employees for teaching and research, many with PhDs, who require correspondingly higher salaries compared with workers with lower academic qualifications. Activities taking place in higher education institutions focus on producing intellectual knowledge rather than physical goods. As a result, spending on compensation of employees contributes more than purchases of goods and services.
The figure for the entire South African government was 42%, according to consolidated data from 2016/174.This was derived from financial statements collected from 705 state institutions, including national and provincial government departments, municipalities, extra-budgetary accounts and funds (EBAs) and higher education.
For more information, download the latest Financial statistics of higher education institutions report here. Note that the accounts of higher education institutions have been converted from an accrual to a cash basis of recording for the purpose of the report. Financial data for specific institutions are available on request. Email info@statssa.gov.za for more information.
1 That is, R40 billion out of a total of R66 billion (excludes capital expenditure).
2 Department of Higher Education and Training, Statistics on Post-School Education and Training in South Africa: 2017, Table 10.1 (see here).
3 Stats SA, How much does SA business spend on its employees? (read here).
4 Stats SA, Financial statistics of consolidated general government, 2016/17, Table A (see here).
Similar articles are available on the Stats SA website and can be accessed here.
For a monthly overview of economic indicators and infographics, catch the latest edition of the Stats Biz newsletter here.