Provincial government spending: Education and health
South Africa’s 123 provincial government departments spent just over R17 600 per second in the 2017/18 fiscal year. That represents a total of R557 billion over a period of 365 days. The bulk of the money flowed into provincial governments’ two main areas of responsibility: education and health.
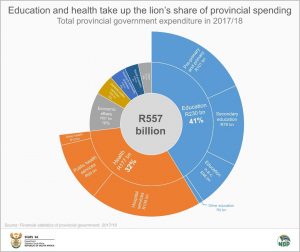
Education took up the lion’s share. For every R100 of total spending, R41 (R230 billion) was spent on education, according to the latest Financial statistics of provincial government report. That is not surprising, as provincial governments are responsible for keeping the wheels of public education turning, most notably the administration of just over 23 700 public schools with 12,3 million learners (2016 figures).1
Pre-primary and primary schooling contributed R101 billion (44%) of the R230 billion, followed by secondary education (click on the image to enlarge).
It might be surprising at first to learn that tertiary education contributed a much smaller R388 million (0,1%) to total education spending, finding itself in the ‘other education’ category in the chart above. It is important to note that other spheres of government (for example, national government) take on the bulk of tertiary education spending in South Africa, which is not reflected here. The latest Financial statistics of consolidated general government report, for 2016/17, provides a much more comprehensive picture. Total tertiary education spending, across all spheres of government, amounted to R77 billion in 2016/17.2 Stats SA will publish additional data on tertiary education in its Financial statistics of higher education institutions report, due for release on 24 October 2019.
Shifting back to the chart above, health was the second biggest expenditure item for provincial government in 2017/18, taking up 32% (R177 billion) of total spending. The primary focus of spending was on hospital services, taking up R108 billion or 61% of total healthcare expenditure. The public-sector healthcare system consists of about 580 public hospitals and 3 500 public clinics and health centres, according to data from the Health Systems Trust (March 2018 figures).3
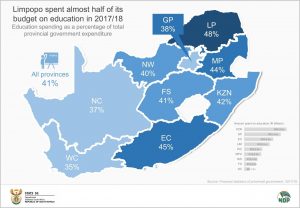
Breaking it down by province, Limpopo spent almost half (48%) of its total budget on education in 2017/18. Together with Limpopo, the more rural provinces of Eastern Cape, Mpumalanga, KwaZulu-Natal and Free State allocated over 40% of total spending to public education.
In terms of actual rand values, KwaZulu-Natal – the second most populous province in the country after Gauteng – was the biggest spender on education, totalling R49,3 billion. Gauteng was the second biggest spender, followed by Eastern Cape.
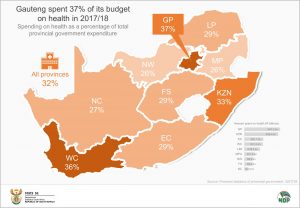
The predominantly urban provinces of Gauteng and Western Cape come to the fore with healthcare spending. Gauteng provincial government spent 37% of its budget on healthcare, and Western Cape 36%. Mpumalanga and North West had the lowest percentages.
Gauteng also had the highest healthcare bill, spending R41,2 billion on health-related activities. KwaZulu-Natal was the second biggest spender, followed by Eastern Cape.
For more information, download the Financial statistics of provincial government 2017/2018 report here. Stats SA publishes detailed reports on the financial status of all spheres of government, including national government, provincial government, local government, extra-budgetary accounts and higher education institutions. A consolidated report, containing financial data for all spheres for the 2017/18 fiscal year, is scheduled to be published in November 2019.
1 Department of Basic Education, Education Statistics in South Africa, 2016, Table 1 (download here).
2 Stats SA, General government spending slows in 2016/17 (read here).
3 Health Systems Trust, South African Health Review 2018. Table 41 (download here).
Similar articles are available on the Stats SA website and can be accessed here.
For a monthly overview of economic indicators and infographics, catch the latest edition of the Stats Biz newsletter here.


