
An update to municipal spending and revenue (June 2019)
South Africa’s 257 municipalities spent a total of R101,3 billion in the second quarter of 2019 (April to June). This is the first time that quarterly municipal spending has breached the R100 billion mark.
The R101,3 billion is R15,3 billion more than what was spent in the first quarter (January to March), representing an increase of 18%. This was mostly driven by municipalities buying more electricity during the winter months, according to the latest Quarterly financial statistics of municipalities report.
To give an idea of how large R101,3 billion is, imagine if this amount was equally distributed across the entire South African population of 58,8 million1 people. Each person would receive roughly R1 720. This is how much it costs municipalities to provide services – such as water, electricity and sanitation – to millions of households across the country every three months.
Employee-related costs and purchases of electricity were the biggest expenditure items. The municipal workforce comprised just over a quarter of a million employees in 2018.2 In the quarter ended June 2019, employee costs amounted to R26,7 billion, or 26% of total spending.
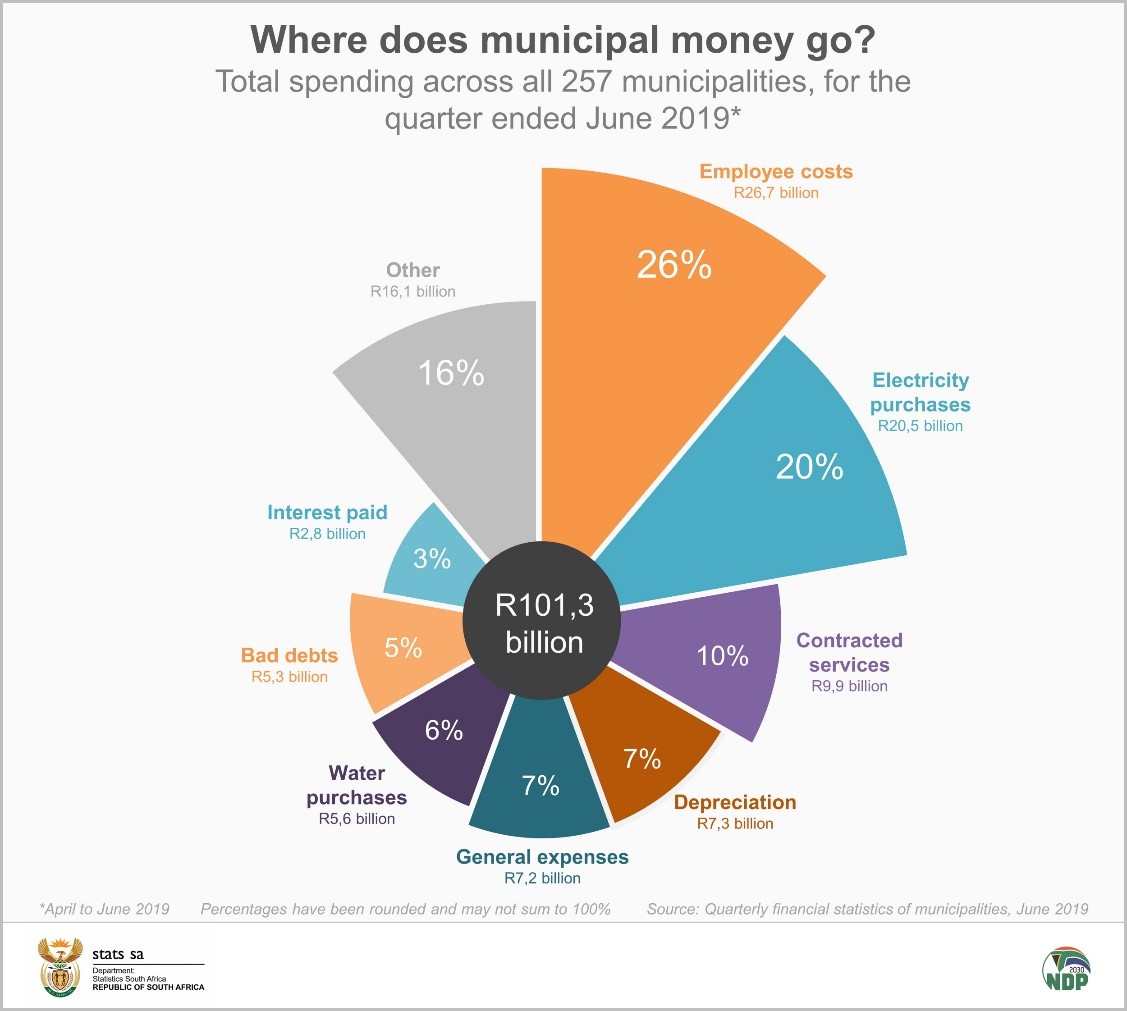
Purchases of electricity was the second biggest expenditure item, accounting for R20,5 billion (or 20%). Many municipalities play an intermediary role, purchasing electricity directly from Eskom and then reselling it to households, businesses and other institutions. Municipalities sold this electricity for R26,5 billion, ensuring a much needed surplus of R6 billion.
The third largest expenditure item was contracted services, followed by depreciation and amortisation. General expenses, the fifth largest item, consists of fuel and oil, audit fees, accommodation and travelling costs, hiring of plant and equipment, among other items.
On the income side of the coin, municipalities received or generated R98,2 billion in the June quarter. Money sourced from electricity sales contributed 27% of total income. The second biggest source of income was money received from other levels of government, in the form of grants and subsidies.3
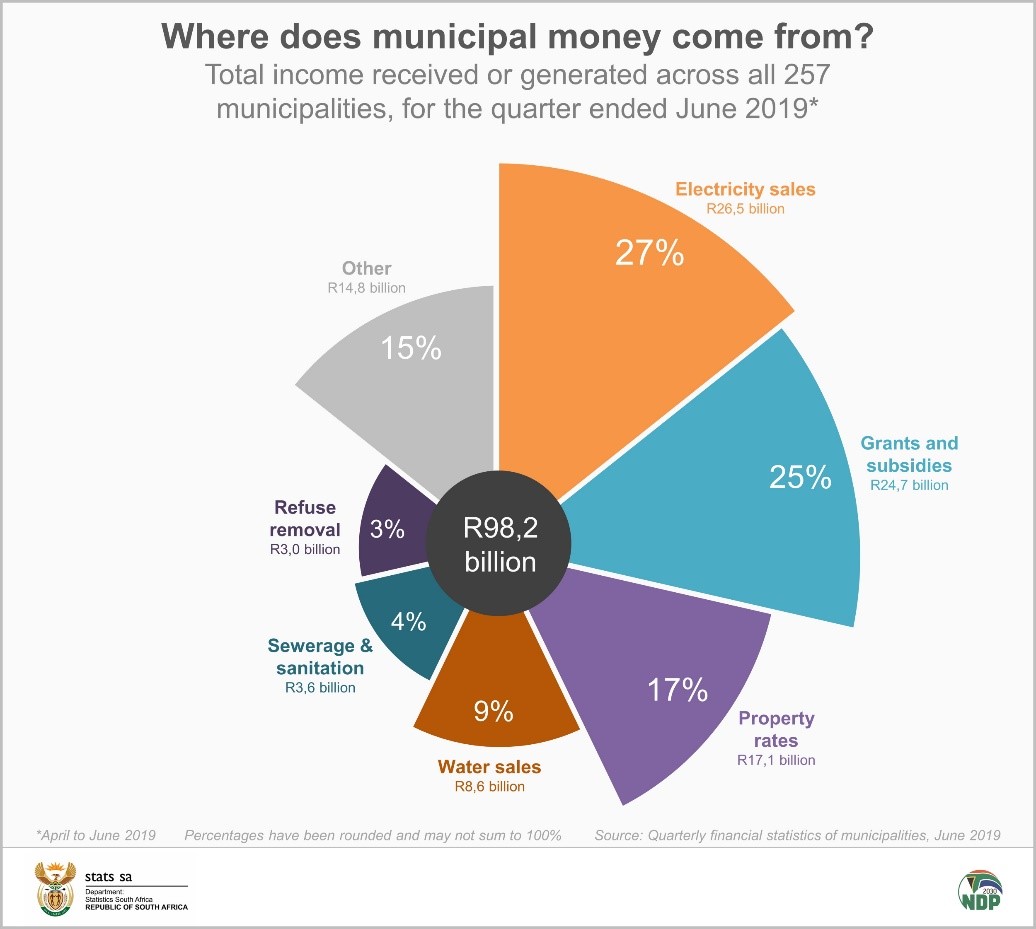
Municipalities sourced R17,1 billion in the form of property rates, collected from all property owners. This is the third biggest source of income for municipalities, but individually this differs from municipality to municipality depending on whether the municipality is predominantly urban or rural.
The fourth biggest source of revenue was sales of water (9%), followed by sewerage and sanitation services (4%).
Fines, which fall under the ‘other’ category in the chart above, contributed R1,3 billion to total income in the June quarter, rising by 7% compared with the March quarter. Municipalities also charge for the use of their facilities, such as recreation centres and sports grounds. Rental of facilities and equipment, which also falls under the ‘other’ category, amounted to R873 million.
For more information, download the latest Quarterly financial statistics of municipalities report here.
1 Stats SA, Mid-year population estimates, 2019 (download here).
2 Stats SA, Non-financial census of municipalities for the year ended June 2018, Table 2.1 (download here).
3 Not to be confused with social grants, financial grants are transfers from one government unit to another government unit, or to an international organisation.
Similar articles are available on the Stats SA website and can be accessed here.
For a monthly overview of economic indicators and infographics, catch the latest edition of the Stats Biz newsletter here.