
728 million stories, waiting to be told
Wherever you go, you transform the landscape. Imagine living the entirety of your life in the map below. Your daily routine might resemble a zig-zagging pattern as you move across the square cells of the grid. Where you choose to live, work, commute, shop, socialise and play – you influence the economic, social and environmental makeup of each cell you touch.
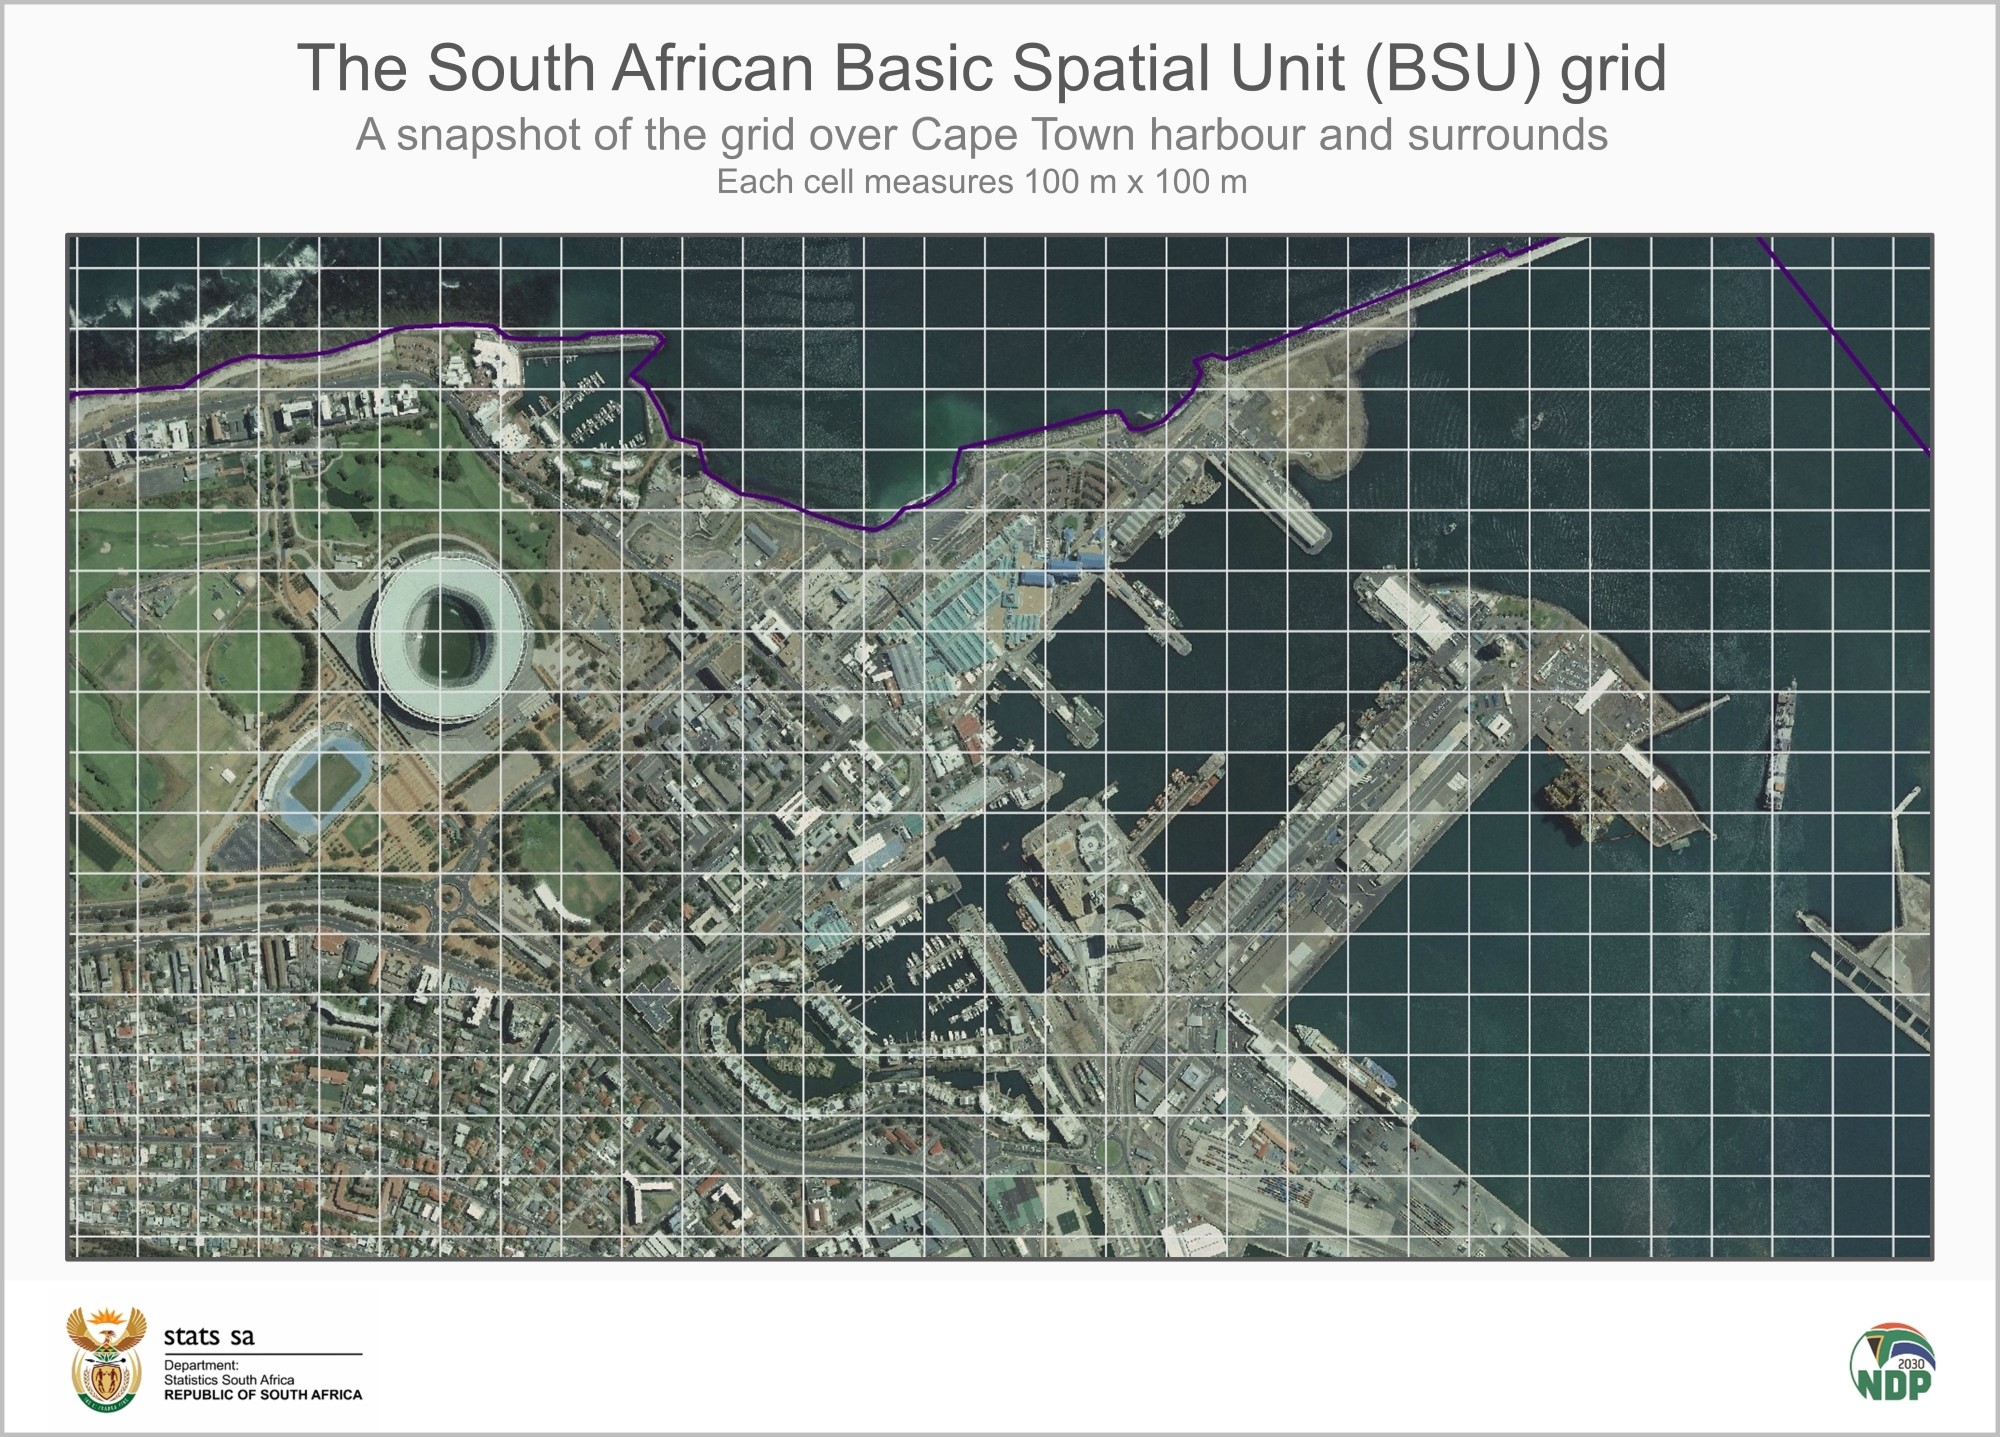
Moulded by millions of actions taken by people and institutions alike, each cell in the map can be seen as having a unique personality. The development of the Basic Spatial Unit (BSU) frame, the grid shown in the map above, is a first step in shedding new light on the complexity of the South African landscape and seascape.
A technical team from Stats SA, the South African National Biodiversity Institute (SANBI), and the National Geo-spatial Information (NGI) component of the Department of Rural Development and Land Reform (DRDLR), recently developed the BSU frame as a way to begin spatially harmonising different datasets. The project was initiated as part of the System of Environmental-Economic Accounting (SEEA), an international framework that measures interrelationships between the economy and the environment.1
The map above, covering the Cape Town harbour and surrounds, shows what the grid looks like. Every cell in the BSU frame is exactly the same size, measuring 100 m by 100 m (or 1 hectare). That’s about the same area covered by a full-sized international rugby field.2
Spanning the entire country, the layer consists of a whopping 728 million cells (or rugby fields, if you like). The Prince Edward Islands and South Africa’s exclusive economic zones in the marine environment are also covered, as well as the river drainage basins shared with neighbouring countries to the north.
The technical team have already begun experimenting. By analysing available satellite data using the BSU grid, the team have been able to assign one of three broad land-use types (natural and semi-natural vegetation, cultivated areas and built-up areas) to every cell. Data from 1990 and 2014 have been used, allowing the team to identify those cells that have experienced a change in land use over time.
This is the first step on a much longer road. Eventually, other datasets will be “snapped” to the BSU grid. The population census, for example, provides a wealth of data on demographics, employment, income, housing and services – often at street-block level. Data are available for the years 1996, 2001 and 2011, with the next census planned for 2021.
By incorporating census data, researchers will be able to start examining possible interrelationships between people and the natural environment. For example, if we find that households in a specific cell are directly dependent on rivers for their daily water supply, can we examine the impact of water quality on those households?
In time, economic datasets might also be included. If a large mine begins operating in a particular cell, will it eventually correlate with a rise in income and employment in surrounding cells? What impact will a new mine have on water quality?
The BSU grid forms the foundation on which large, location-rich data can be spatially harmonised, allowing analysts and policymakers to make meaningful comparisons across datasets and over time. Every decision we make as a country to solve our most pressing issues may have both good and bad consequences. Determining what the consequences are will help us make decisions that carry the most benefit.
Watch this space for more developments.
1 United Nations, What is the SEEA? (read here).
2 The size of rugby field used here is 144 m by 70 m (or 10 080 m2 which is just over 1 hectare). This includes the field of play plus the depth of the in-goal areas (see here).
Read up more on environmental statistics here.
Similar articles are available on the Stats SA website and can be accessed here.
For a monthly overview of economic indicators and infographics, catch the latest edition of the Stats Biz newsletter here.