
Debt owed to municipalities reaches R72,4 billion
We often hear of how much municipalities are in debt. But there is another side of the coin. Municipalities themselves are owed money, often by consumers and institutions.
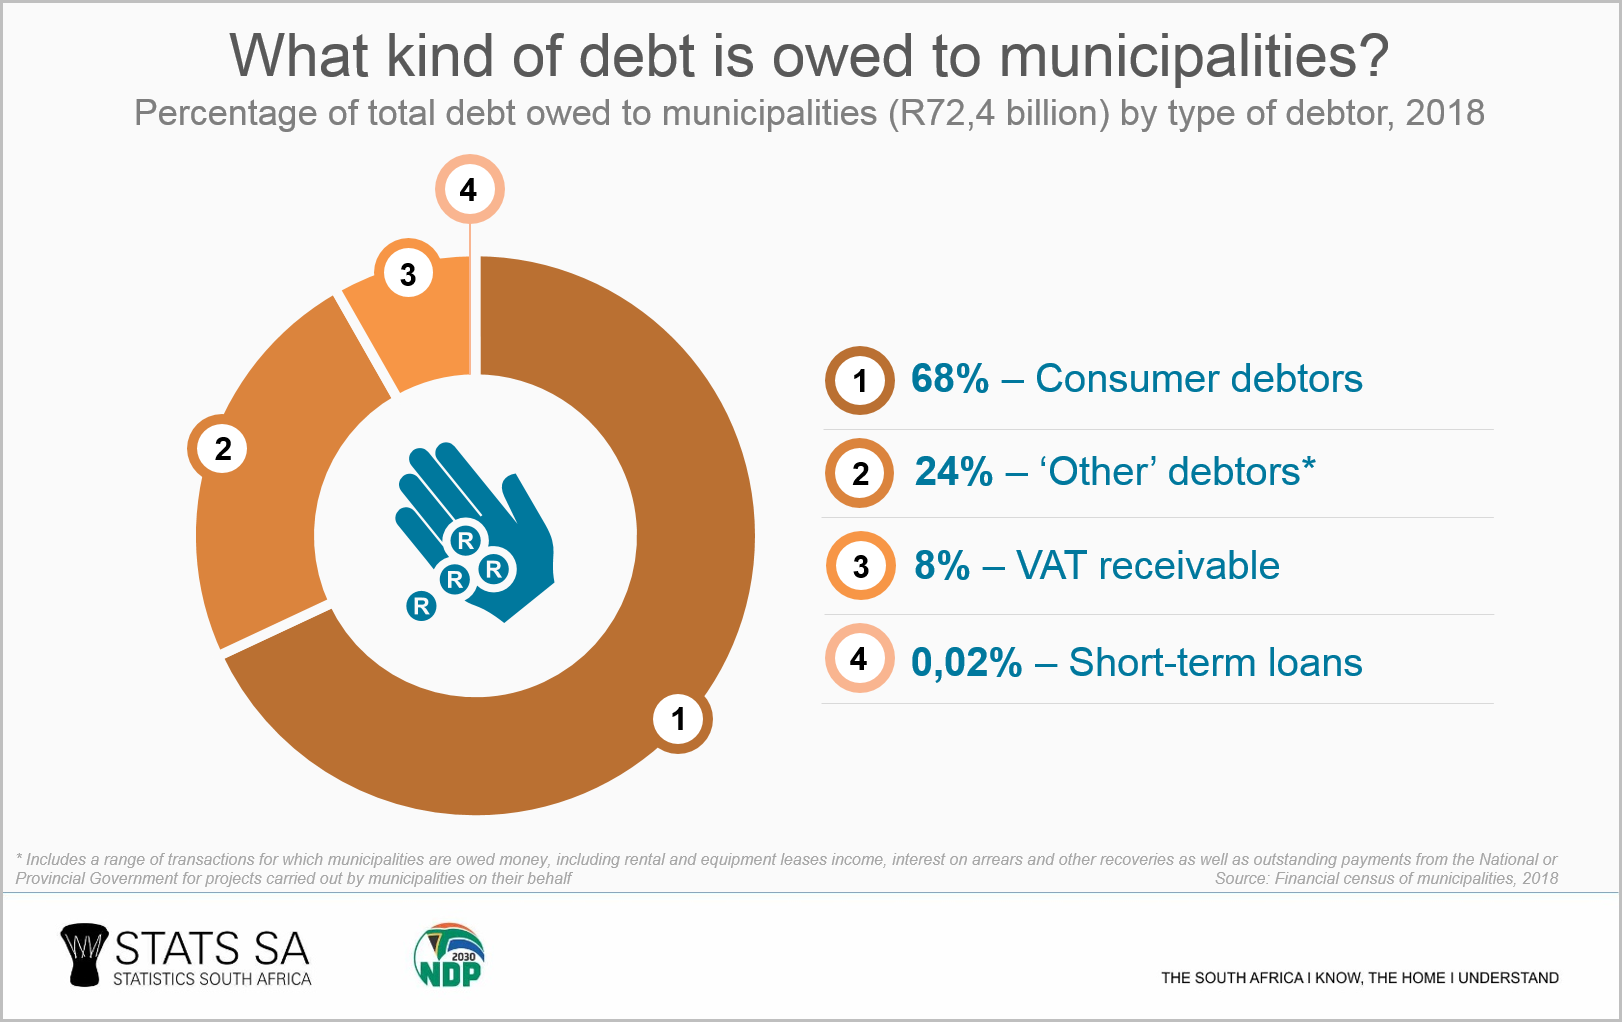
Debt owed to South Africa’s 257 municipalities (referred to as net current debtors1) totalled R72,4 billion in the 2018 financial year, according to the latest Financial census of municipalities report.2 To give some idea of how much this is, imagine if all those owing money to local government suddenly paid up the R72,4 billion. This would raise municipal cash flow by a substantial amount which in turn, could be used to pay creditors or further the provision of services.
If we take a closer look at the R72,4 billion, consumers of municipal services owed just over two-thirds of this amount, followed by the miscellaneous category ‘other’ debtors3 and VAT receivable. Municipalities also grant short-term loans to other companies and institutions, but this makes up only a tiny portion (0,02%).
The Financial and Fiscal Commission (FFC)4 defines municipal consumer debt as the non-payment of property rates, fees/charges for services provided by municipalities (e.g. water, sanitation, electricity and refuse removal) and various other financial obligations to municipalities (e.g. traffic fines and rental housing payments).
For any business entity, the management of debtors or accounts receivable is of paramount importance in order to warrant solid cash flows. Municipalities are no exception, even though they are not businesses per se. For them, better management of debtors can help them deliver services to their residents.
Total debt owed climbed by 14,7% (R9,3 billion) between the 2017 and 2018 financial years, mostly driven by rising consumer debt (up R6,9 billion) and VAT receivable (up R1,3 billion).
Possible reasons for the escalating current net debtors are the economic downturn, un-affordability due to low or loss of income, dissatisfaction with service delivery and ineffective municipal billing and credit control systems.
The amount of debt owed to municipalities can be analysed further using the ratio of net current debtors to current assets. This ratio, often expressed as a percentage, discloses the size of debt owed against current assets (i.e. those assets that can be easily converted to cash within a year).
The rule of thumb is that the higher the percentage, the higher the cost of the debt owed, in terms of an opportunity cost. If money was not confined in net current debtors, it could have been used or invested elsewhere.
The country’s net current debtors to current assets ratio for municipalities was 56% in 2018. This means that for every R100 of funds available in the form of current assets, there is another R56 that is locked up in the form of debt owed.
The ratio varies across municipalities, as can be seen in the map below. A number of municipalities have a ratio close to 100%. Examples include uPhongolo (KwaZulu-Natal), Matjhabeng (Free State), and Enoch Mgijima (Eastern Cape).

The ratio for all local municipalities is 62% and for metropolitan municipalities 54%. The City of Johannesburg, Mangaung, City of Tshwane and Ekurhuleni have ratios above 50%.
For district municipalities (not shown in the map above) the ratio is much smaller (39%). A low ratio is not unusual for district municipalities as they don’t usually provide services to their constituencies, nor do they charge property taxes. Services and property rates are the responsibility of local municipalities. However, there are a few exceptional cases where district municipalities provide water in their respective jurisdictions, and as a result they have net current debtors listed on their books.
The amount owed to municipalities is steadily increasing every year. There could be many reasons for this. A number of municipalities may have poor strategies in place to collect debt. On the other hand, residents could be prioritising their spending on clothing, food and other commodities above those of rates and services.5
Download the latest Financial statistics of municipalities report here.
1 Municipal net current debtors constitute all debt owed to municipalities from both exchange and non-exchange transactions that is due in the next twelve months. This is after deducting all the debt impairment allowances (provision for bad debts – the monies owed that are unlikely to be received) as well as the actual bad debts written off by municipalities.
2 Data published in the Financial census of municipalities report is verified against the annual financial statements received from municipalities. The publication does not include debt collection periods (age analysis of debtors), long-term debtors or receivables, or prepayments or prepaid expenses. Note that all the figures in this article are expressed in nominal rand.
3 ‘Other’ debtors includes a range of transactions for which municipalities are owed money, including rental and equipment leases income, interest on arrears and other recoveries as well as outstanding payments from the national or provincial government for projects carried out by municipalities on their behalf. Source: BBrief Newsletter 2017. Municipal debtors management critical. Available here.
4 FFC (Financial and Fiscal Commission), 2012–2013 technical report submitted for division of revenue. Available here.
5 Kruger, N. Collection of outstanding monies owed by municipal debtors. IMFO: Official Journal of the Institute of Municipal Finance Officers 3, pp 22–23 (2003).