
Household access to services stabilised
The General Household Survey (GHS) 2018 released by Statistics South Africa (Stats SA) found that substantial progress has been made in service delivery over the years. While progress has been uneven across the country, a quick glance at service delivery statistics suggests that household access to these services have stabilised over the last few years.
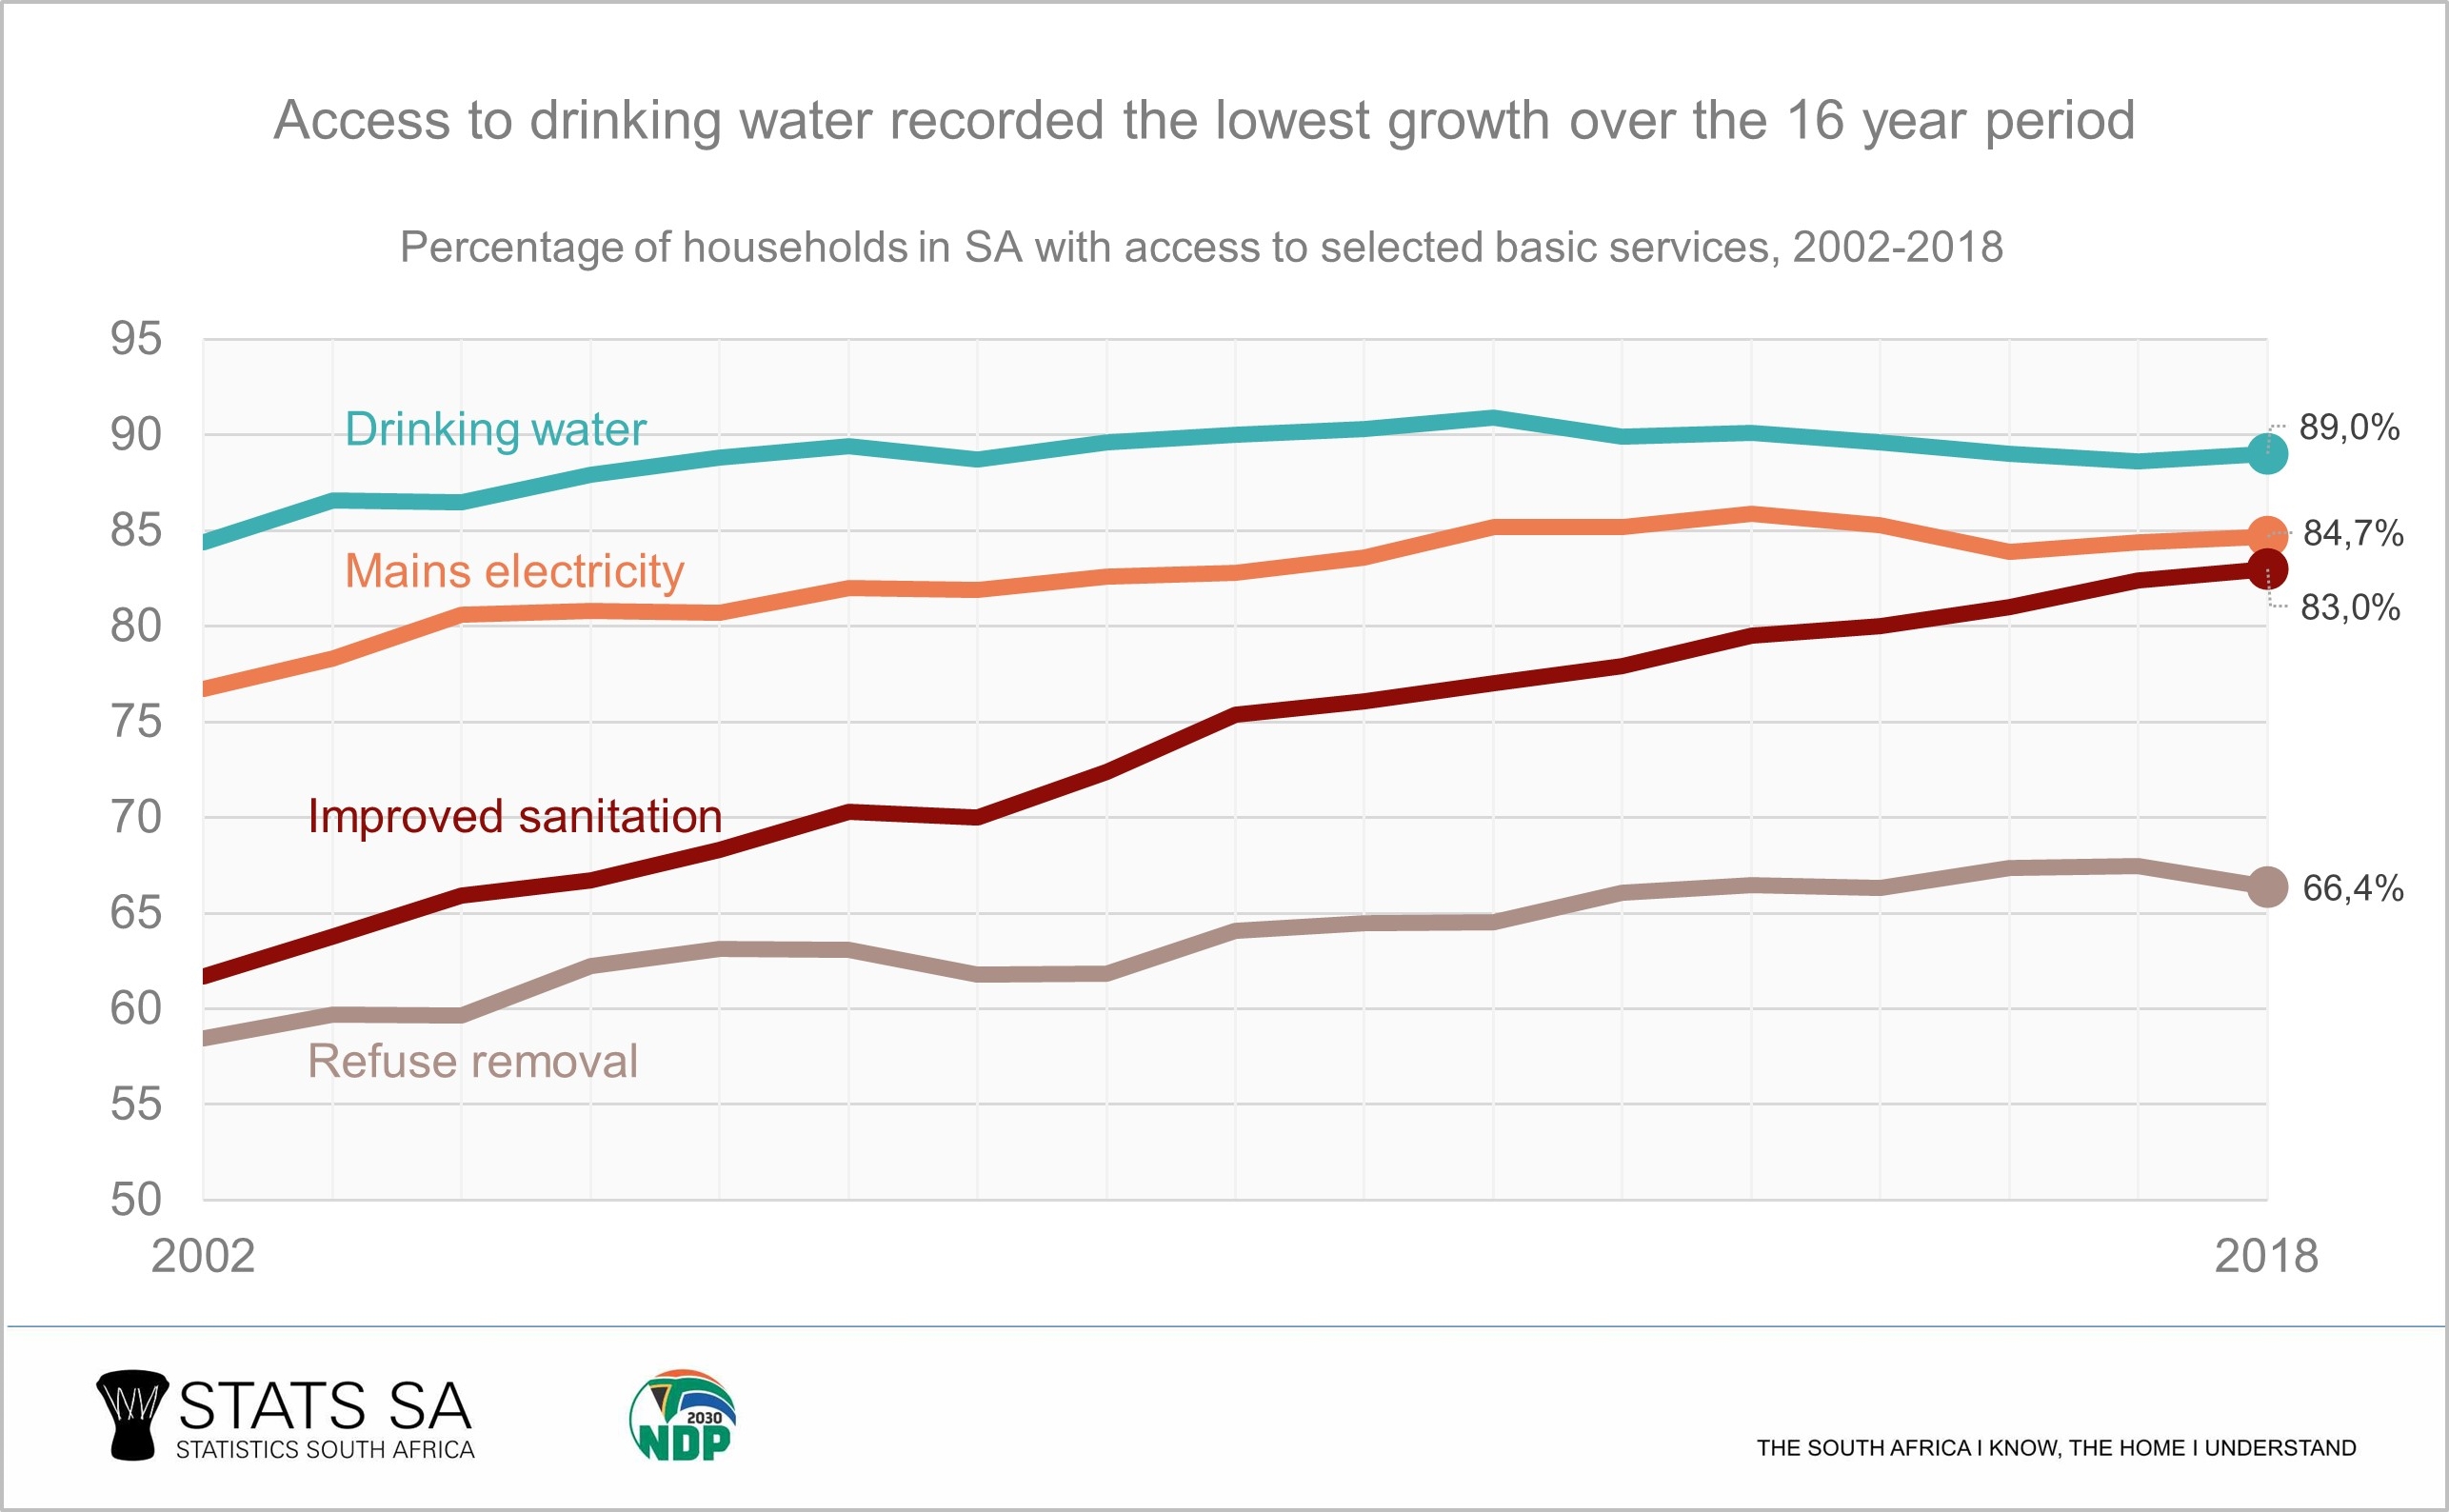
GHS data show that households’ access to drinking water (89,0%) was most common in 2018, followed by access to mains electricity (84,7%), and improved sanitation (83,0%). Access to refuse removal services at home lagged behind at 66,4%. Although access to all four services increased between 2002 and 2018, improvements varied. Access to improved sanitation (flush toilets or pit toilets with ventilation pipes) increased by 21,3 percentage points over the 17-year period, followed by access to mains electricity (8 percentage points) and refuse removal (7,9 percentage points). This may be attributed to the fact that a larger percentage of households had access to drinking water (piped or tap water in the dwellings, off-site or on-site) than any of the other basic services. Access to drinking water was also the service that recorded the lowest growth over the period, at 4,6 percentage points.
The relative growth is compared in the graph below, which outlines the cumulative growth over the period 2002 to 2018 for each service.
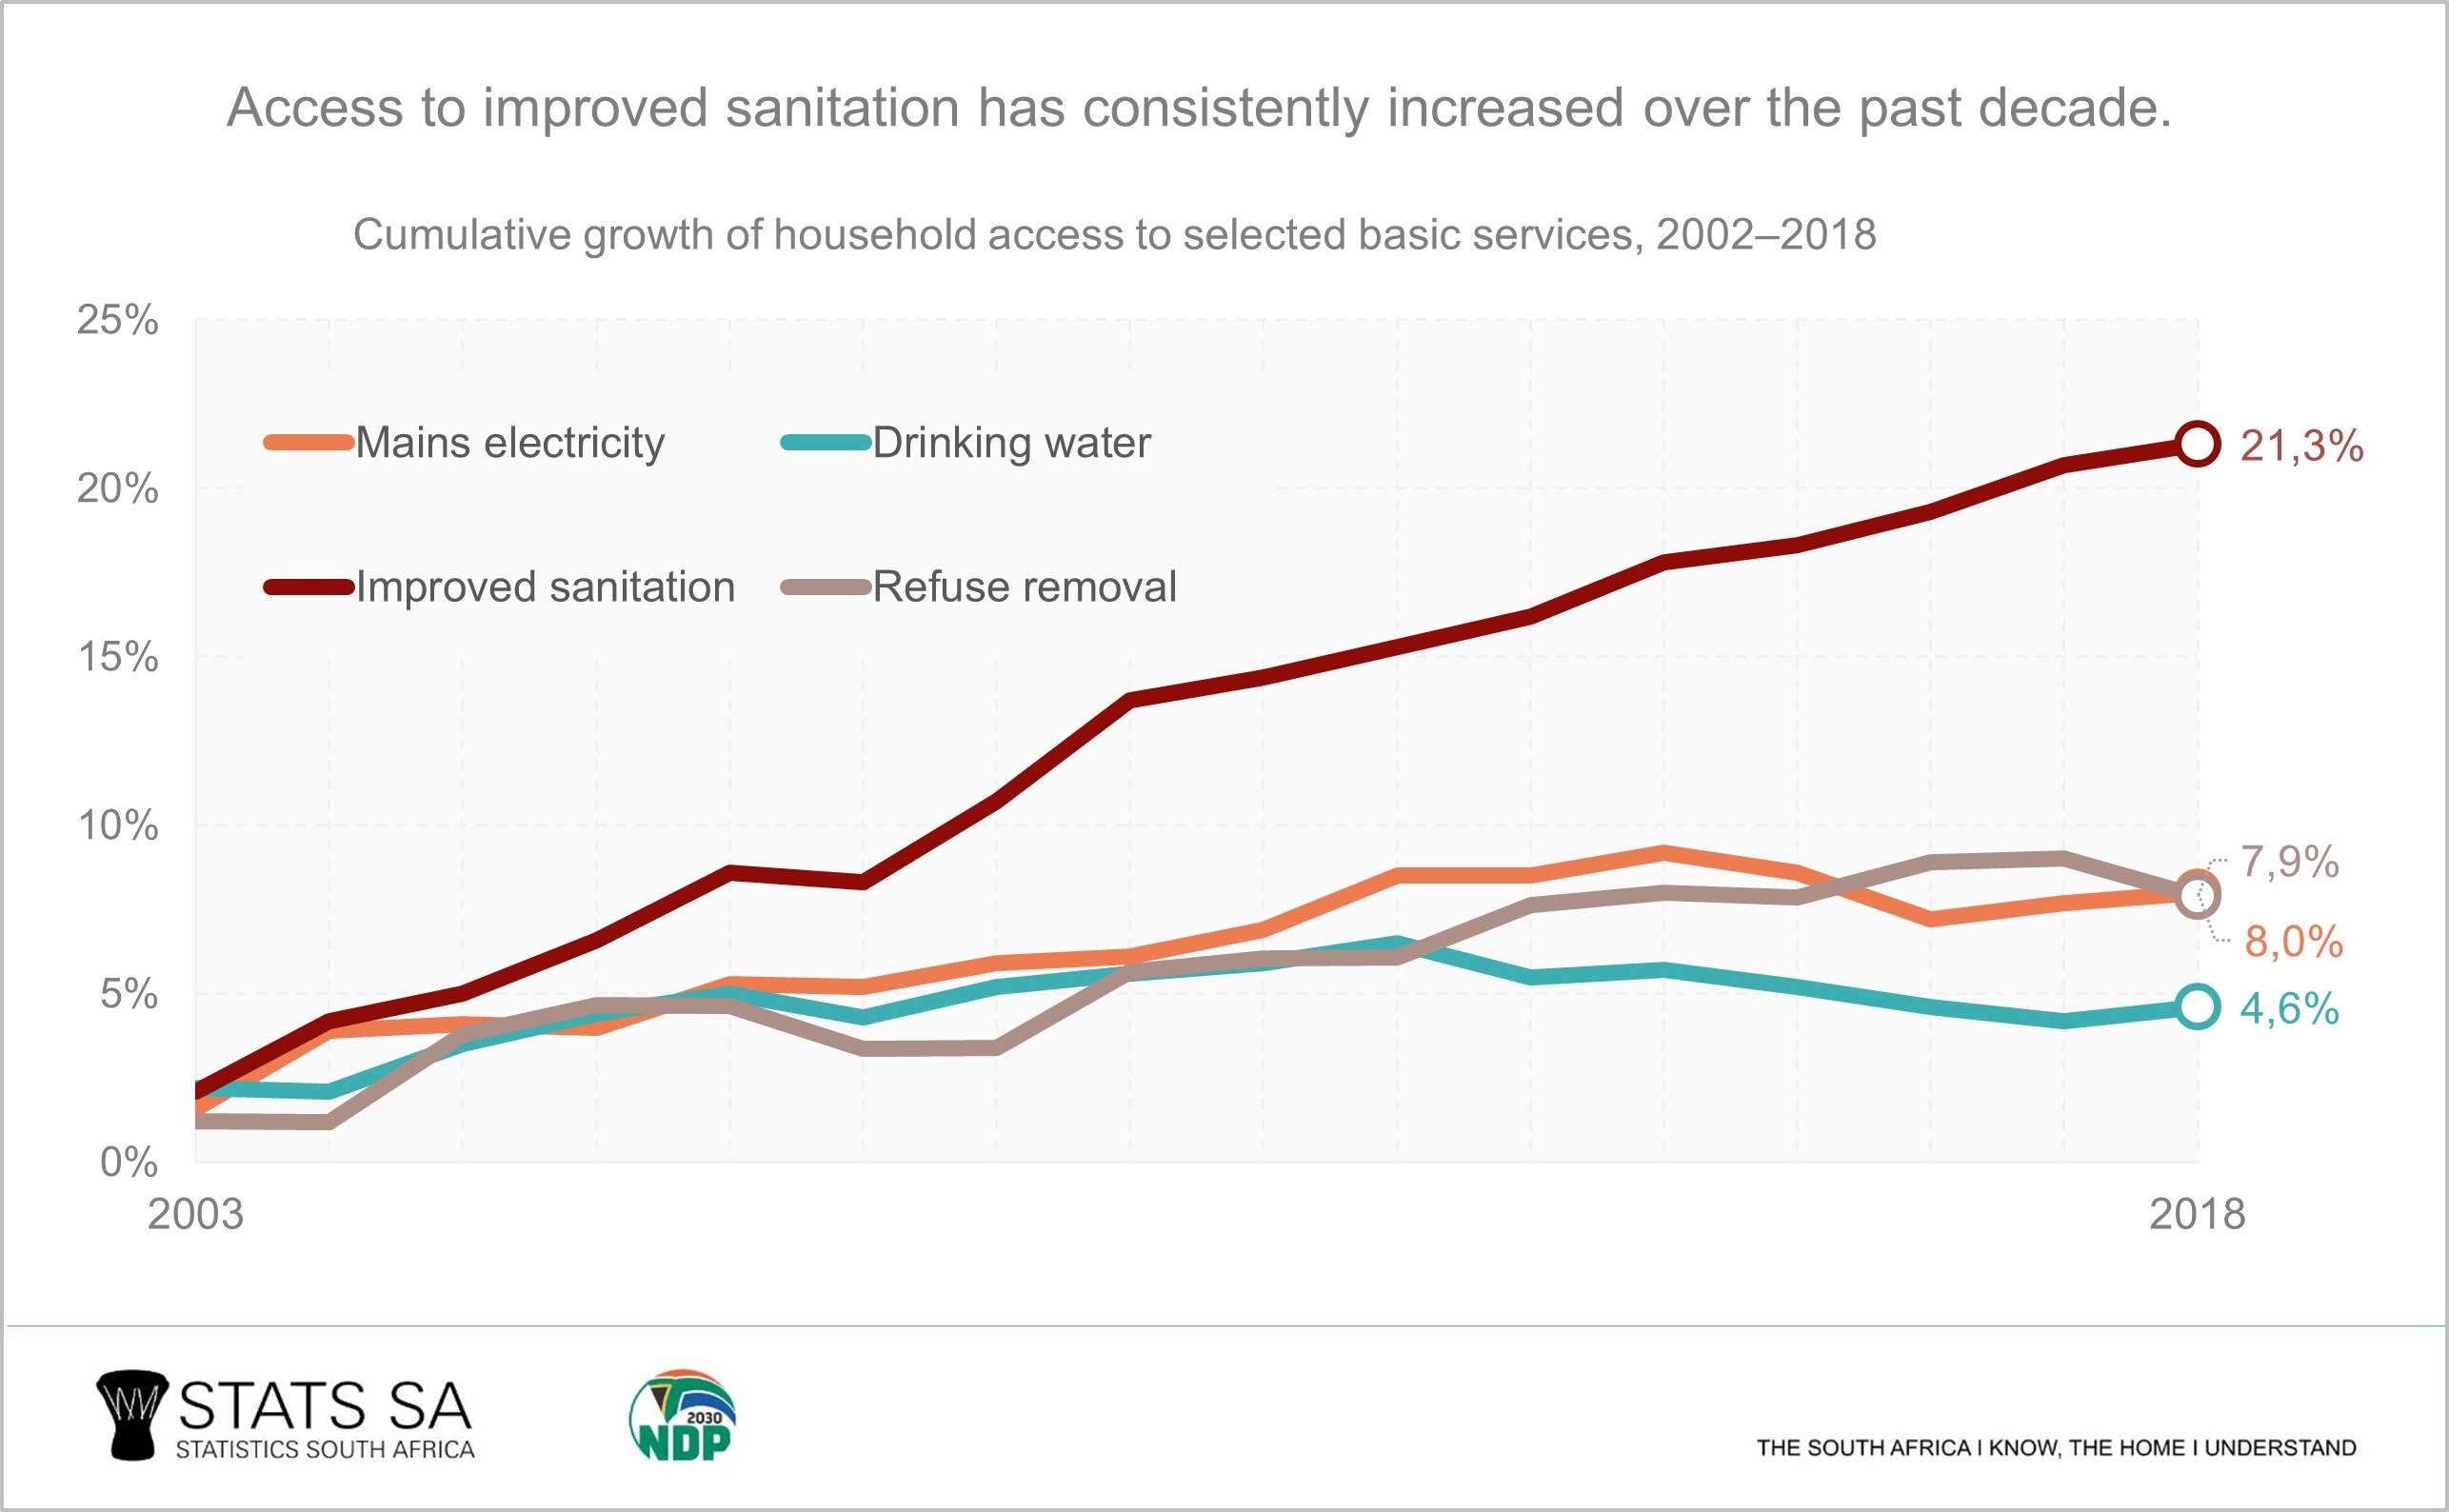
According to the GHS 2018 survey, access to improved sanitation has consistently increased over the past decade. The figures, however, reveal that access to the other basic services has largely stabilised over the past five years, and that in the case of drinking water, access has actually shown negative growth since 2014.
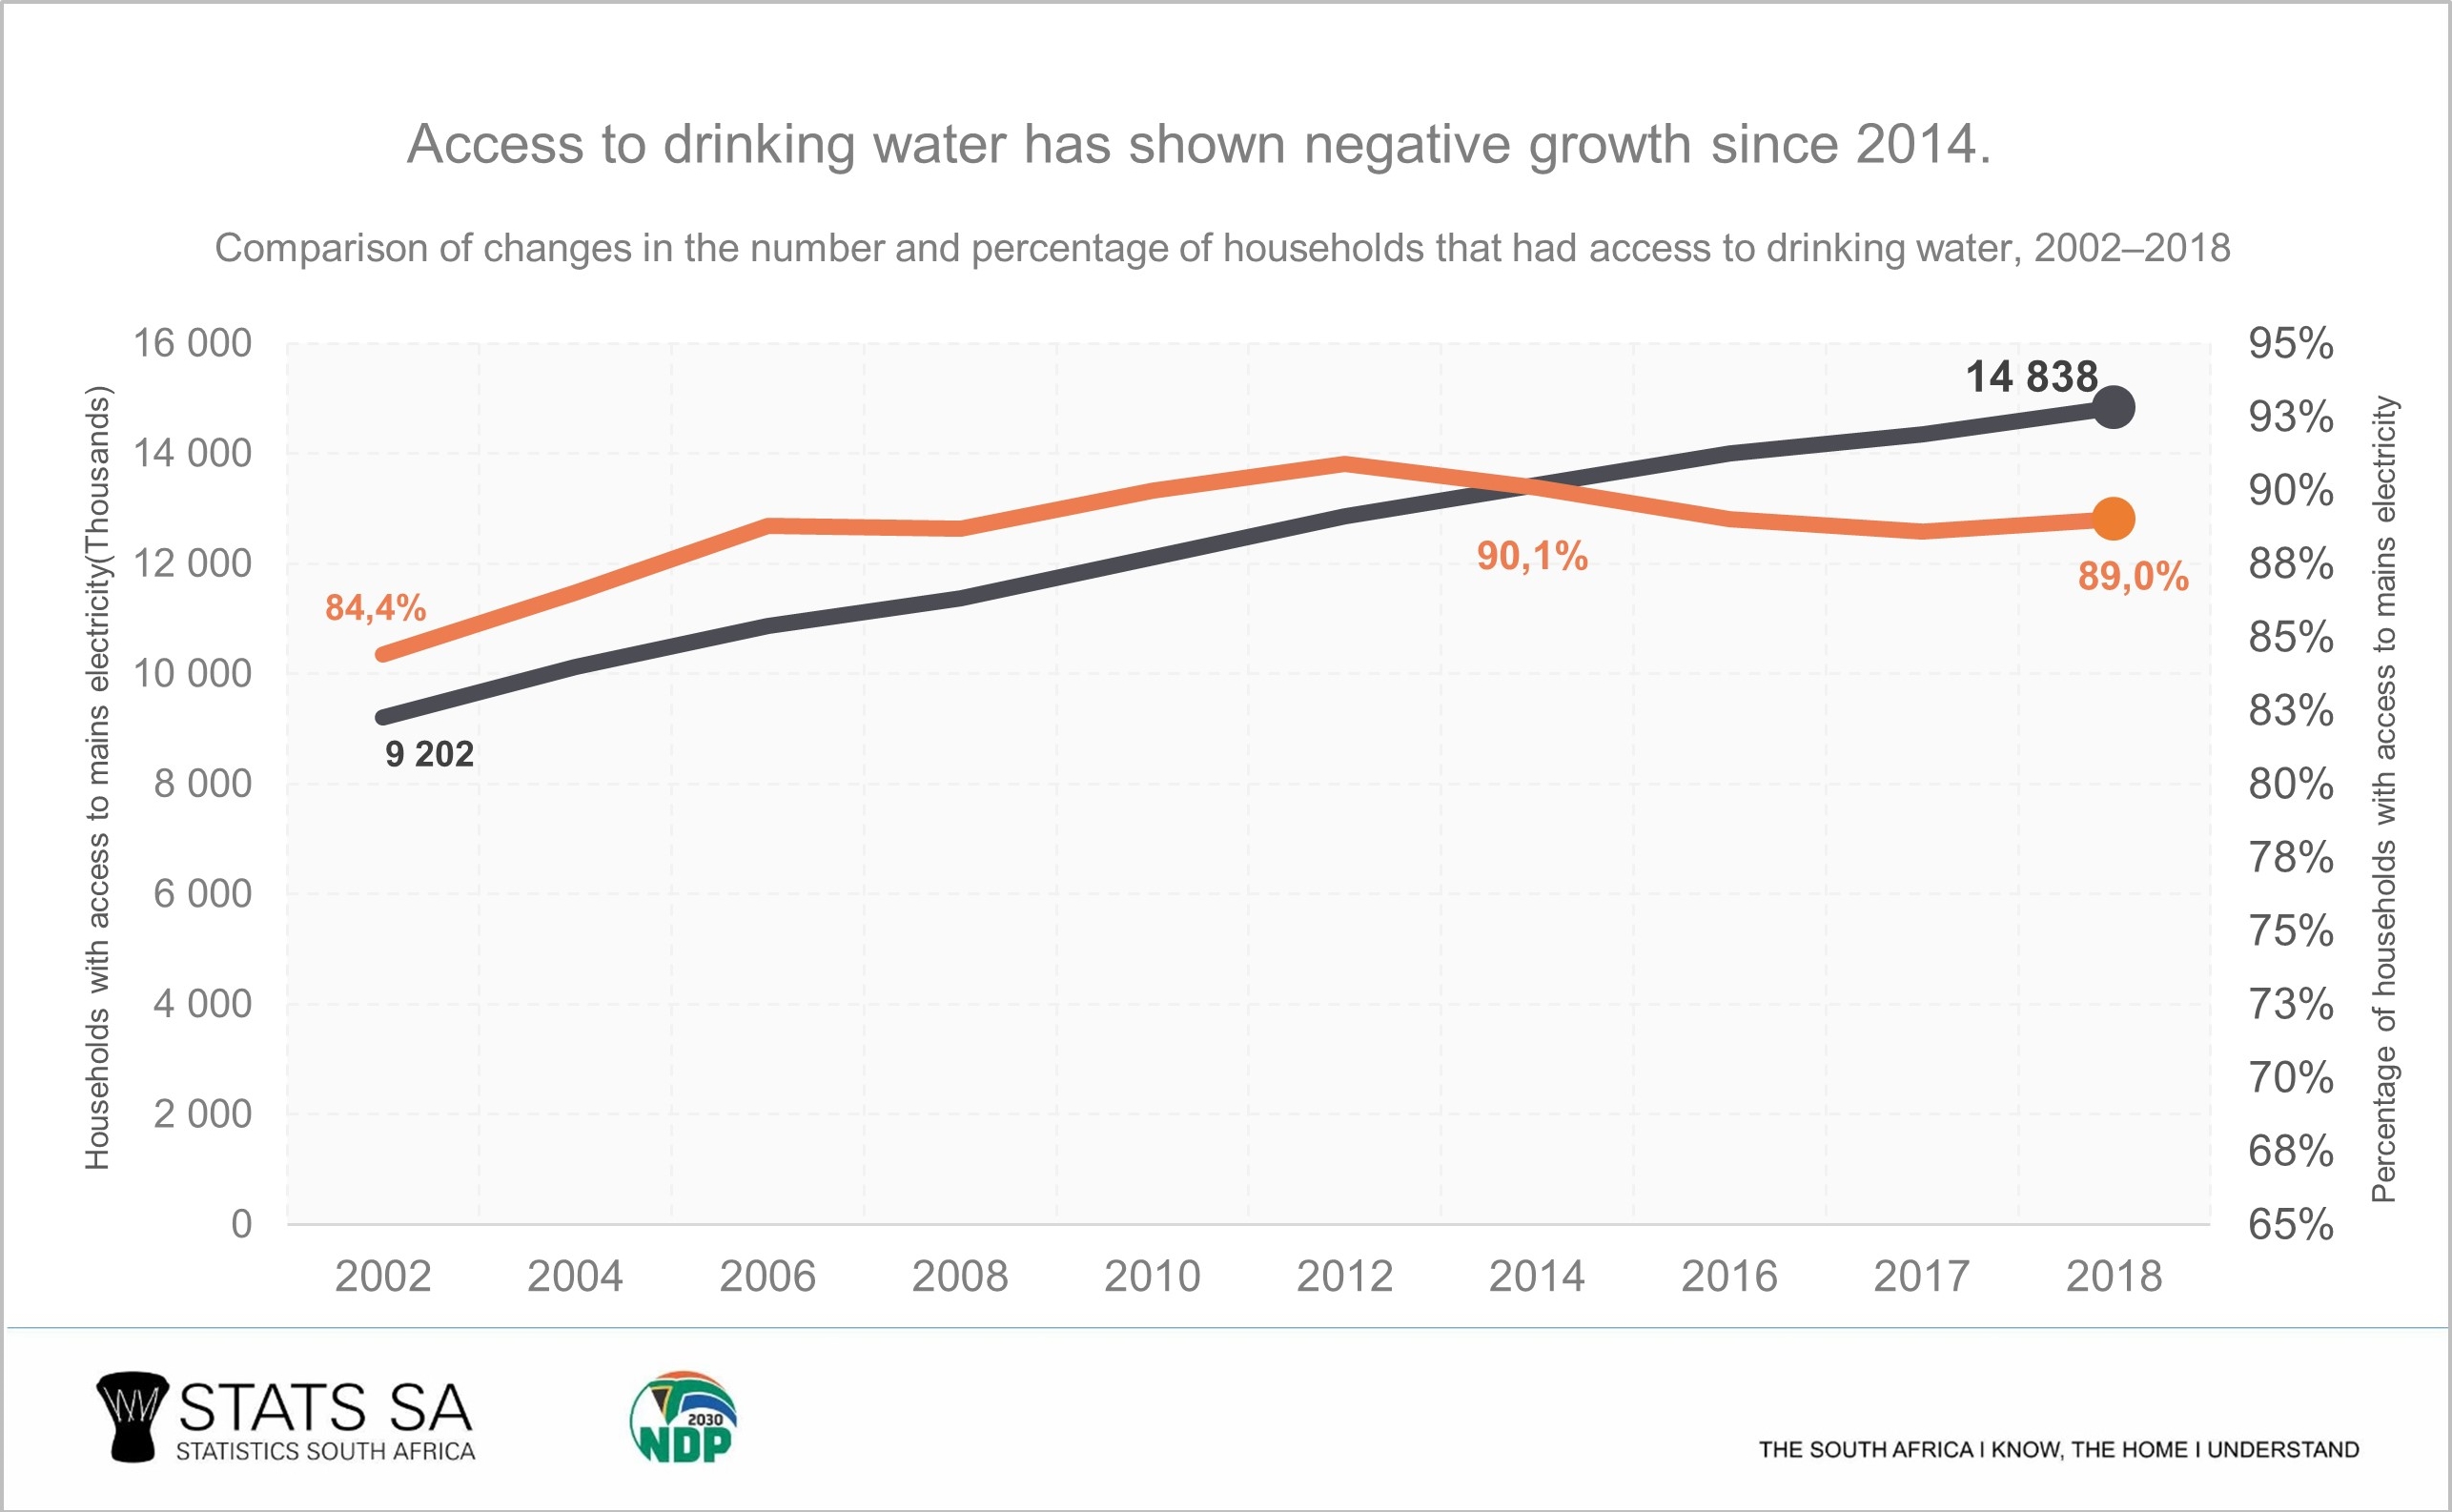
Although the percentages tell a compelling story, it is important to note that the number of households increased by 48,9% between 2002 and 2018, a growth of 2,4% per annum. Since households are the basic unit for service delivery, rapid household growth will constrain the ability of authorities to deliver basic services. Apparent declines in the percentage access to some basic services, however, hide the fact that the number of households with access to the particular services continued to grow from year to year, albeit at a slower pace. In the case of water, the number of households with access to water increased from 13,4 to 14,8 million, even while percentage access seems to have stabilised.
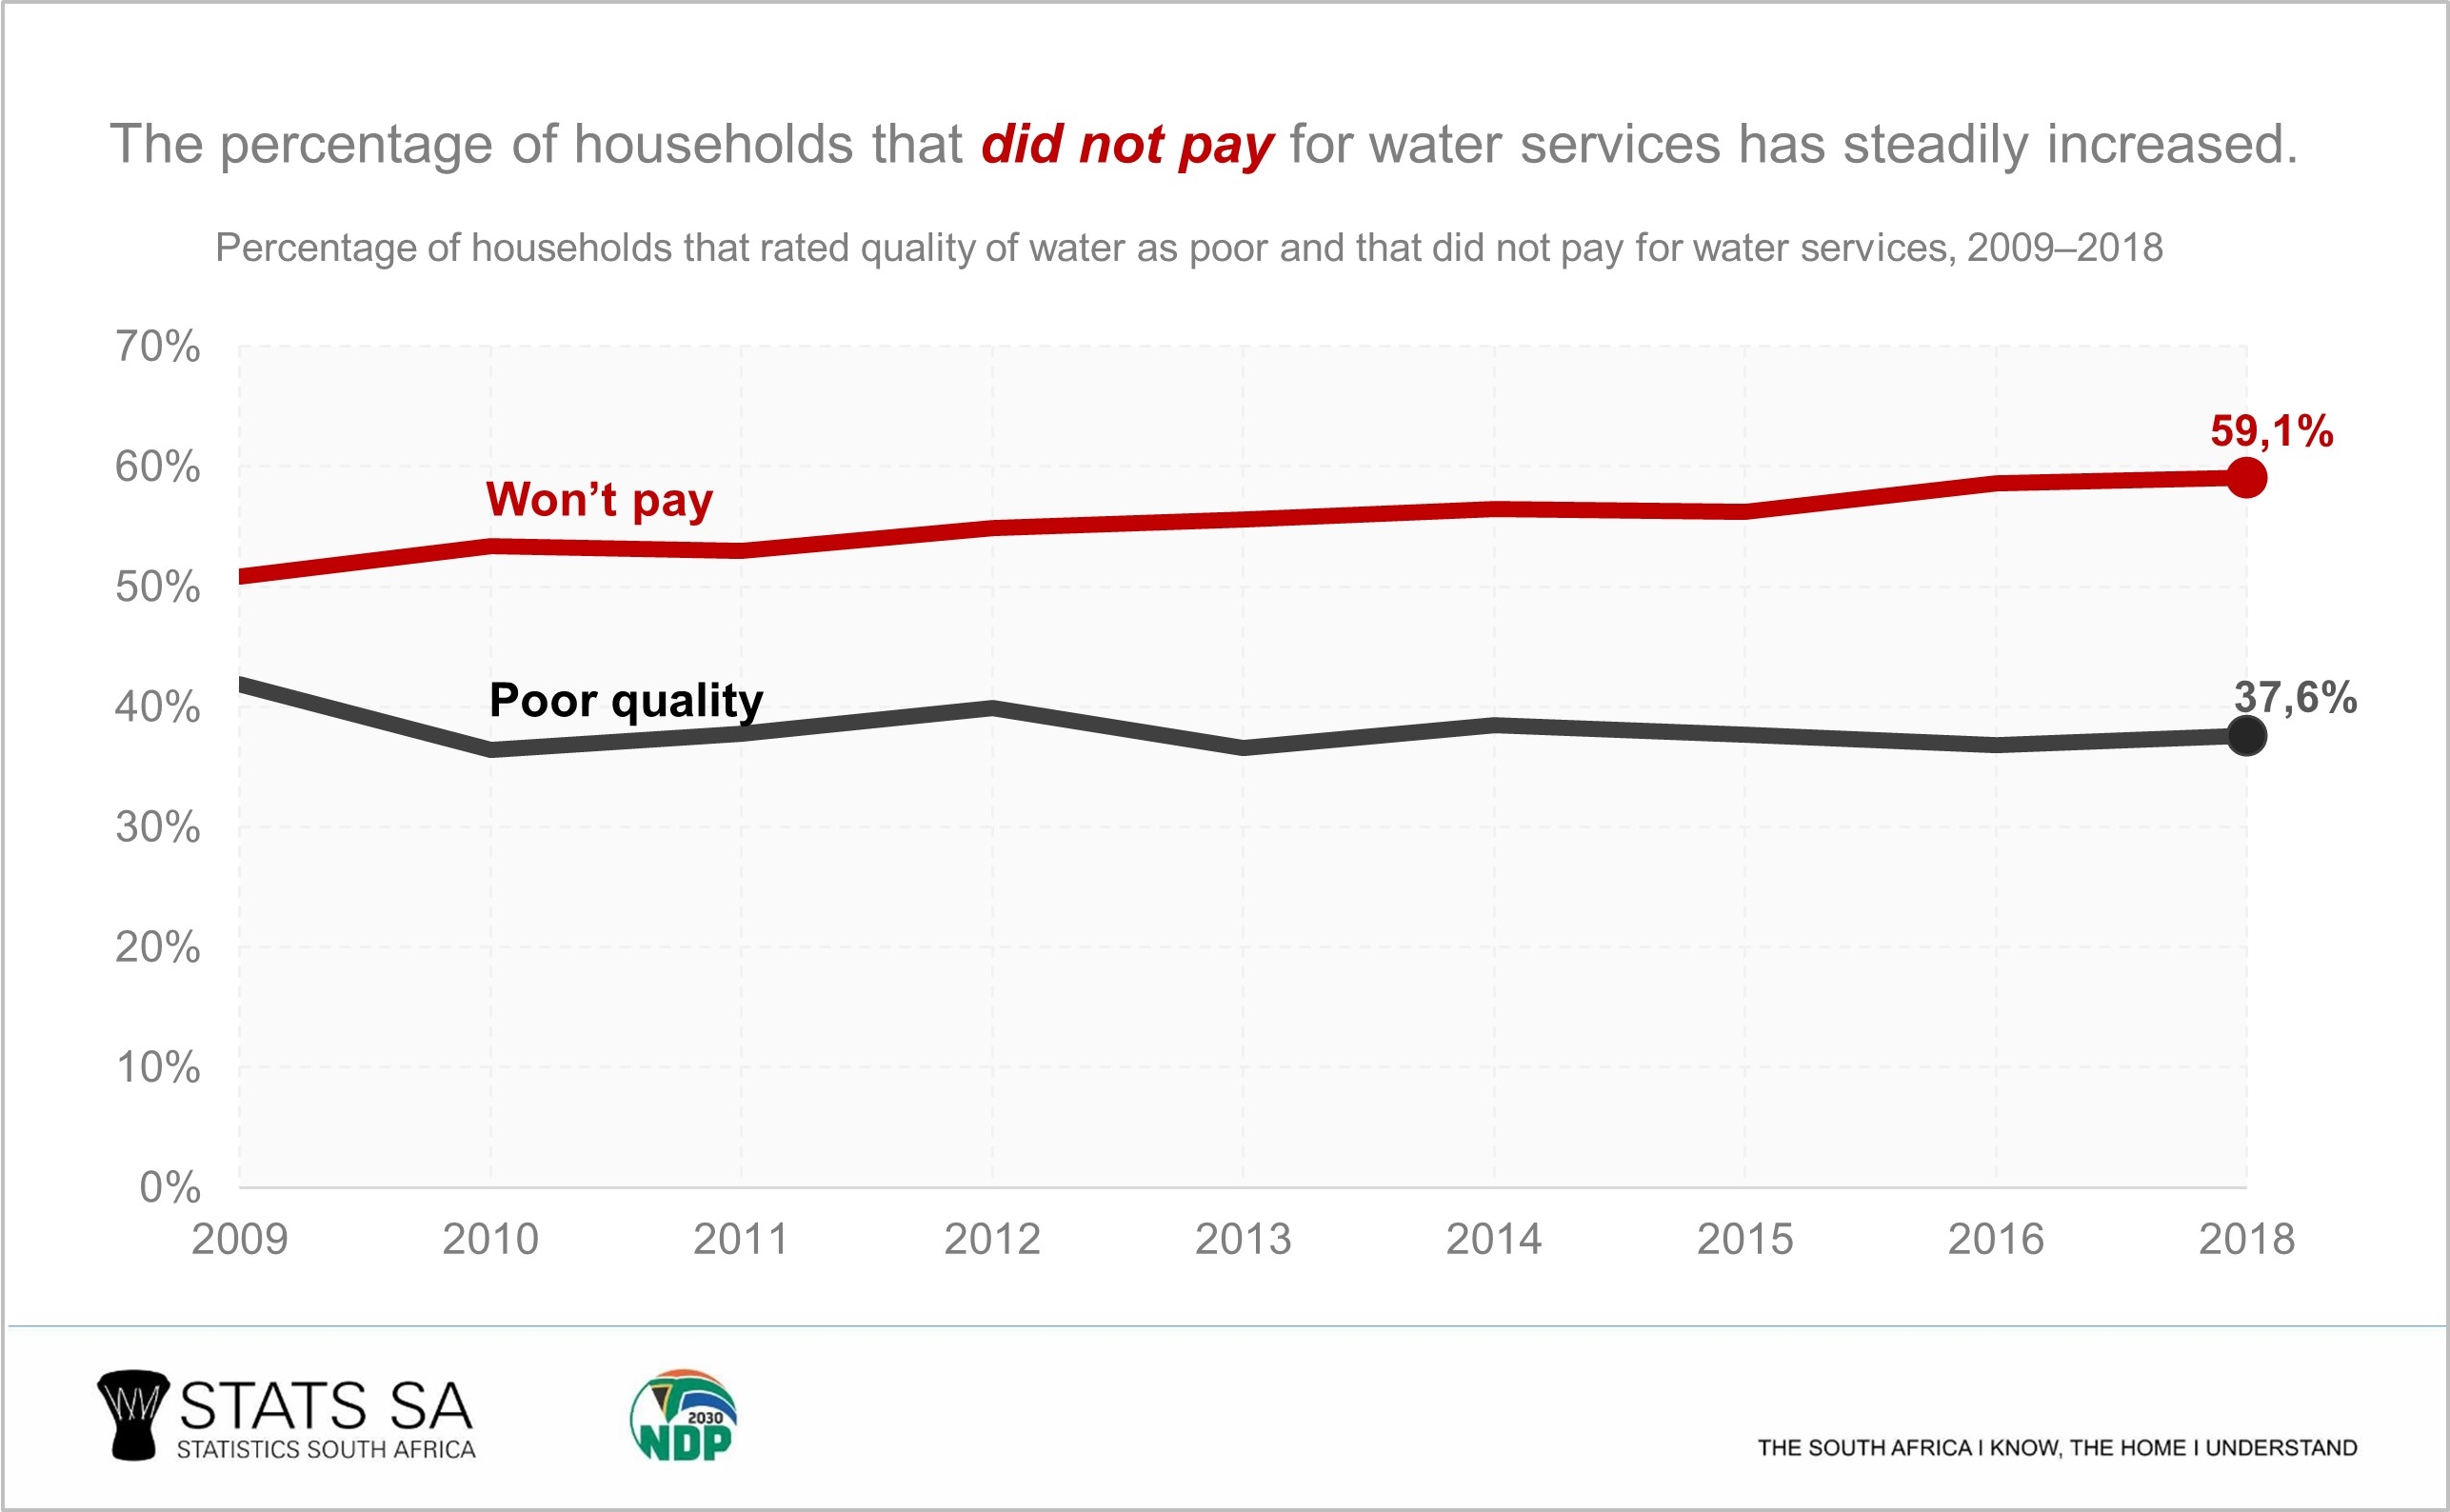
Despite improvements in access to drinking water, more than one-third (37,6%) of households rated the quality of water services they received as average or poor in 2018, while 59,1% did not pay for the water they received. The percentage of households that did not pay for water services has steadily increased from 50,8% in 2009 to 59% in 2018.
For more information on the levels of development in the country as well as the extent of service delivery and the quality of services in South Africa, download the full report here.
The GHS provides information on education, health, disability, social security, housing, energy, access to and use of water and sanitation, environment, refuse removal, telecommunications, transport, household income, access to food, and agriculture