
Government finances: surplus, deficit and debt
Believe it or not, there was a time – not so long ago – when the South African government actually spent less than it earned. Stats SA takes a look at government spending over 13 years, focusing on how much we pay to service our debt.
Harking back to better times in February’s National Budget Speech, Finance Minister Tito Mboweni quipped that his predecessor, Trevor Manuel, had given out succulent plums to highlight the prosperous times the country had then found itself in.
If state expenditure is taken as a measure of better times, there was a three-year period (2005/6 to 2008/9) when government1 spent less than it earned, enjoying a surplus over that period. This is according to time series data from Stats SA’s Financial statistics of consolidated general government report.2
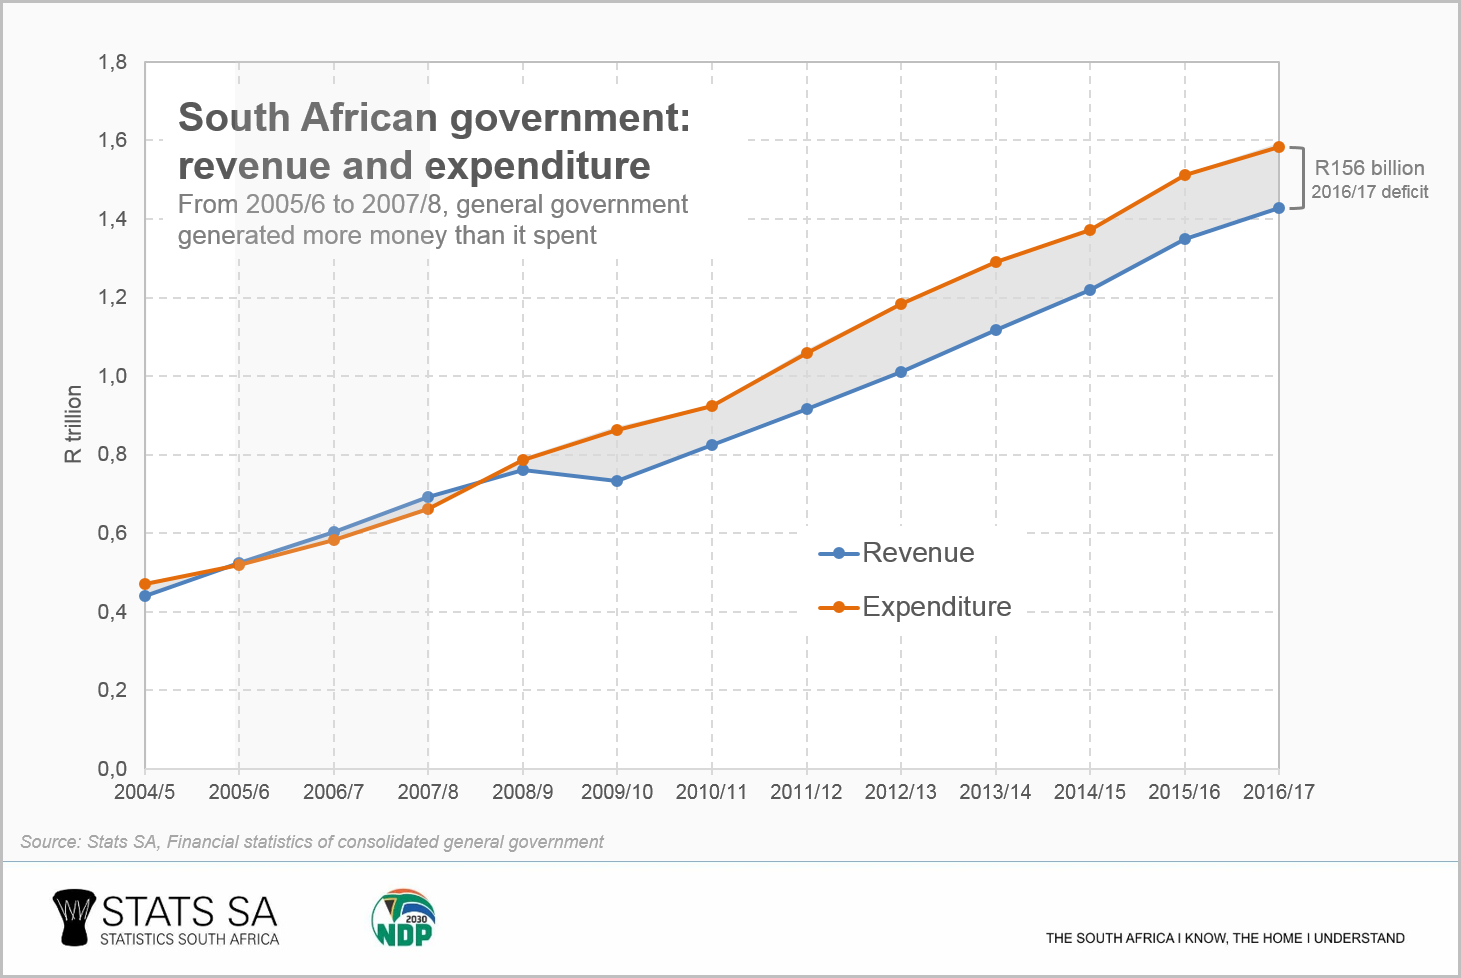
This didn’t last for long, however. The succulent plums quickly shrivelled under the strain of various factors, including the 2008–2009 global financial crisis. The economy floundered in 2008/09, sliding into recession for three consecutive quarters.3 Government revenue fell in 2009/10, mainly underpinned by a fall in tax collected from businesses.4
Revenue bounced back the following year, but not enough to lift government out of the red. Since 2007/08, government has consistently spent more than it earns. The deficit in 2016/17, for example, amounted to R156 billion.5
It should be noted that a budget deficit is not uncommon across the world and should not automatically be seen in a negative light. Countries generally borrow money to cover financial deficits so that they can provide services to their citizens.
South Africa’s gross loan debt stood at R2,2 trillion in 2016/17, according to the National Treasury.6 This translates to about R40 000 per person living in the country.7
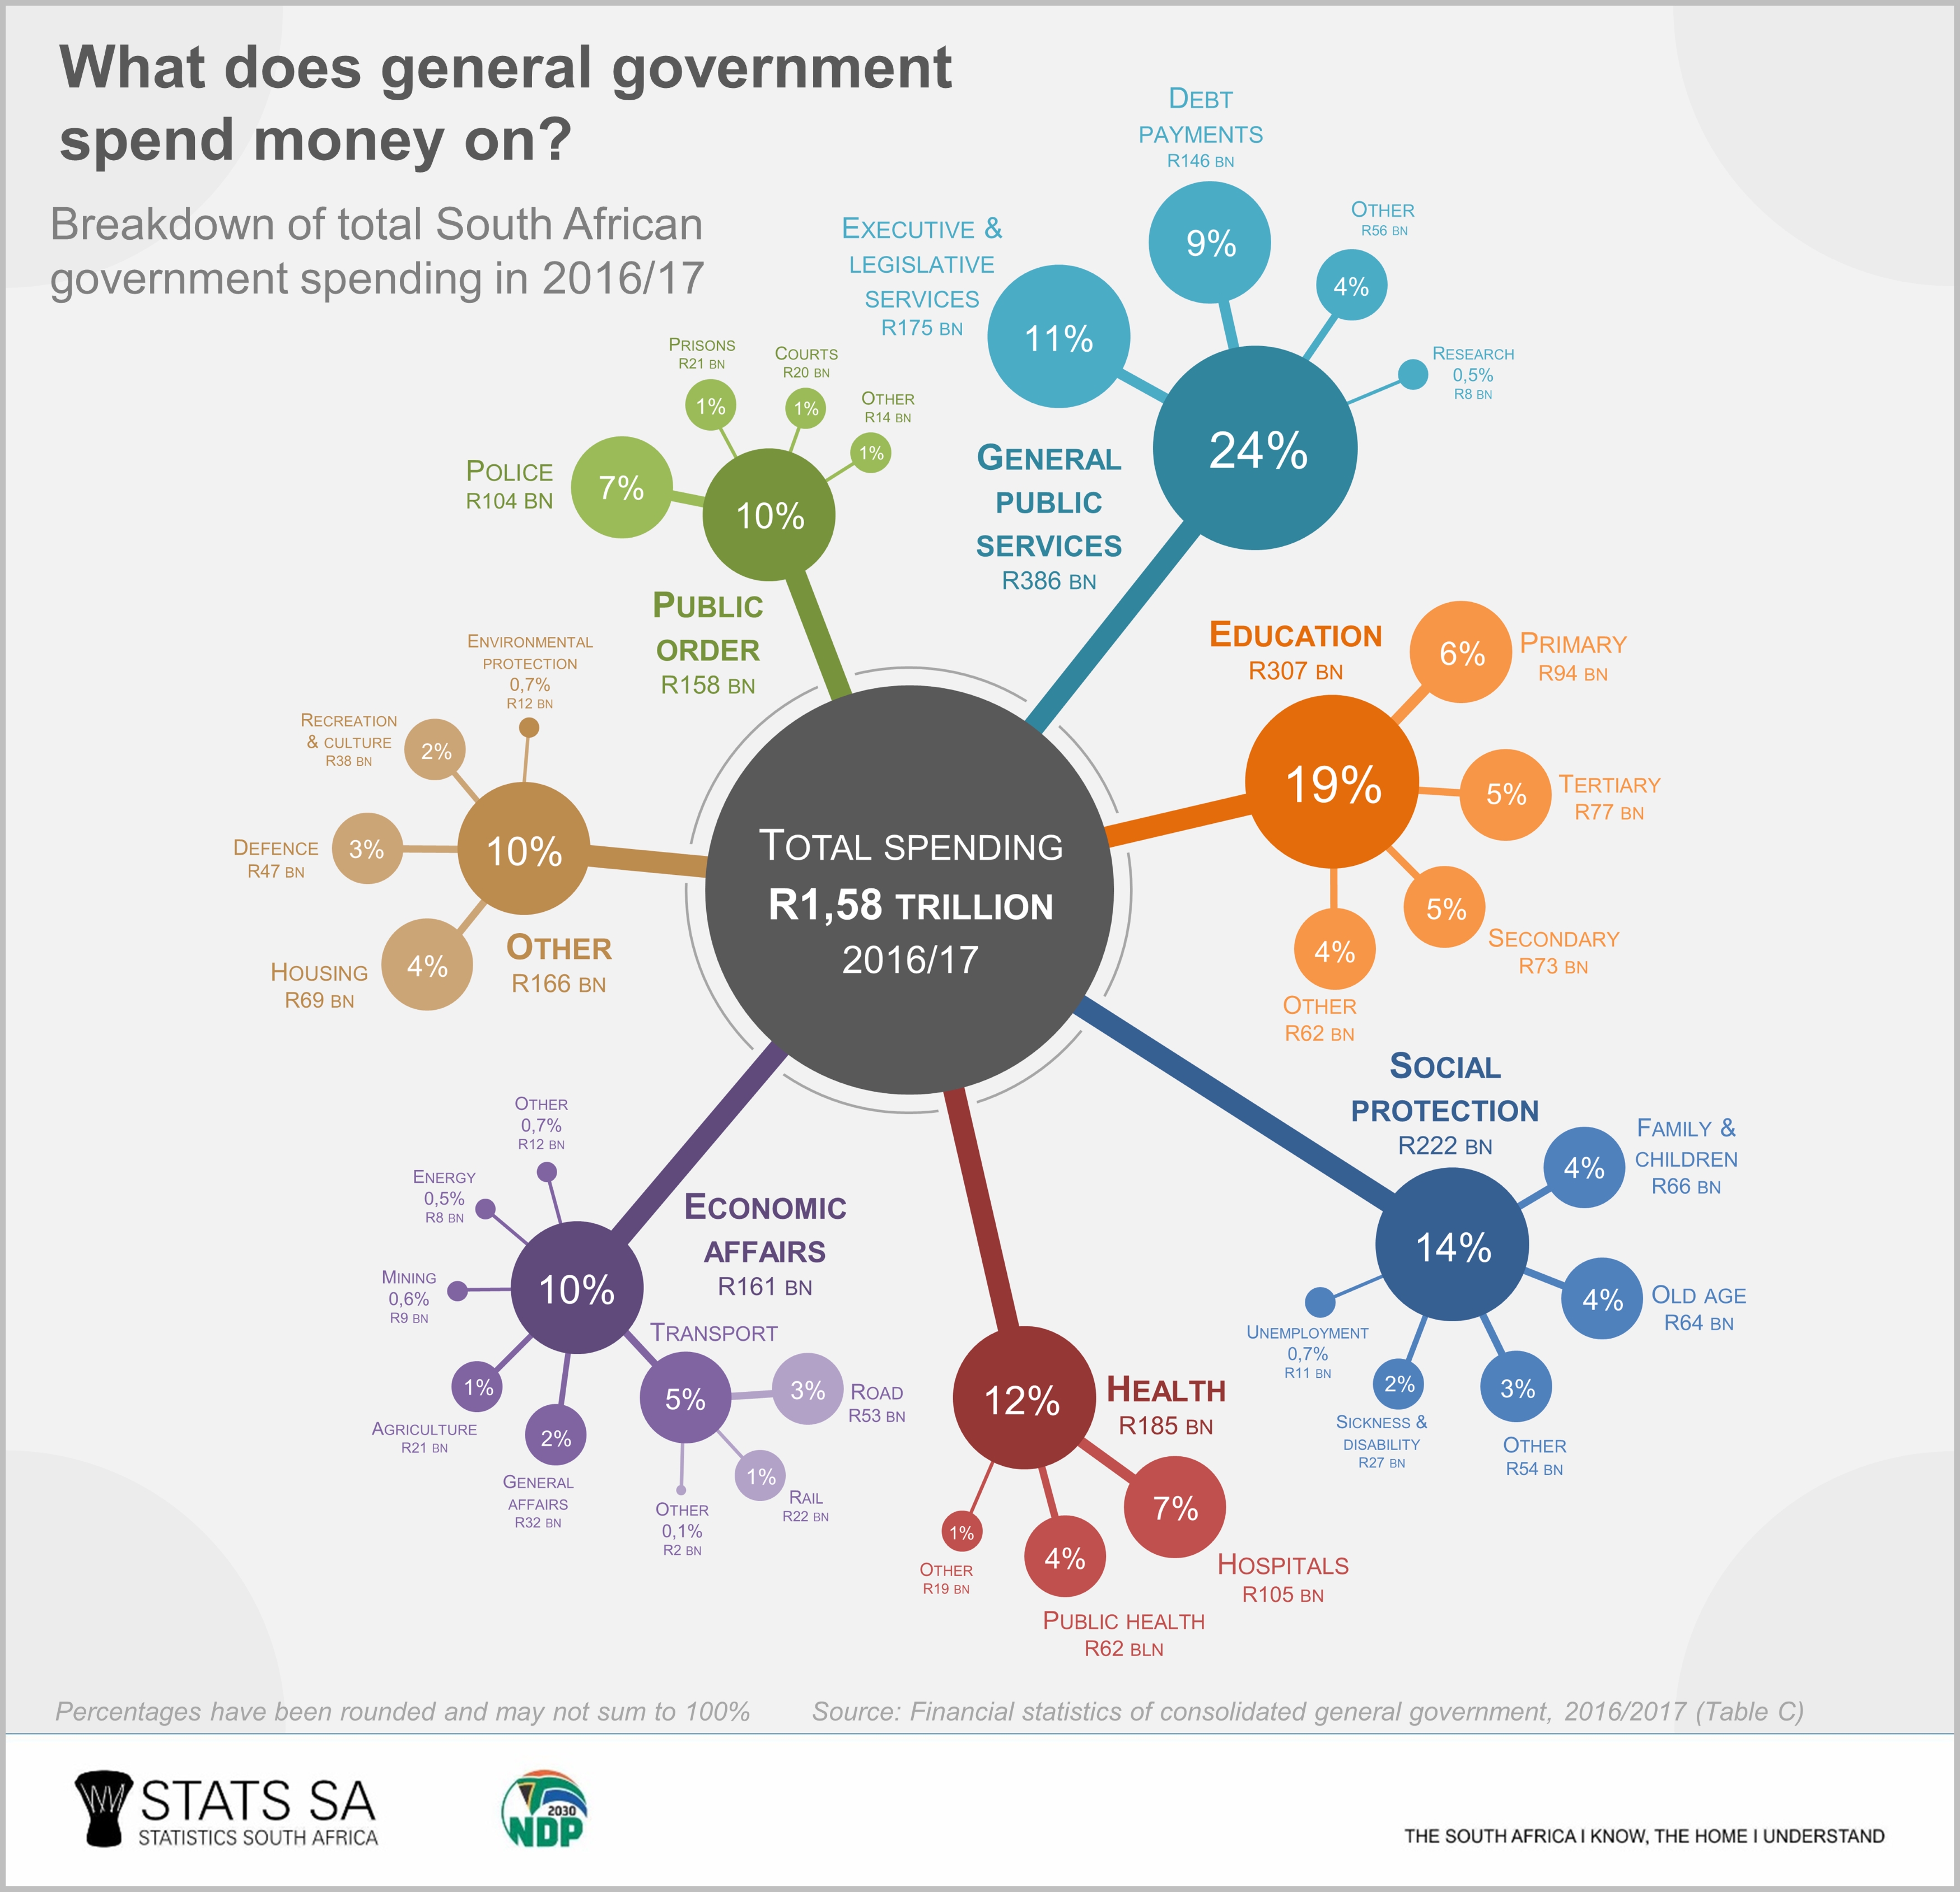
Servicing this level of debt can be expensive. Interest payments accounted for 9,2% (or R146 billion) of general government expenditure (R1,58 trillion) in 2016/17. In other words, for every R100 of total spending, R9,20 was used to pay interest on debt. This is more than what was spent on the hospital (R105 billion), tertiary education (R77 billion) and housing (R69 billion) functions during that period.8
National Treasury expects this figure to rise, reaching 13% of total expenditure in 2021/22.9
How do we square up against other countries? South Africa devoted a larger proportion of its budget to paying interest than other countries such as Russia and China, according to data from the International Monetary Fund (IMF).10 (Click on the map to enlarge)
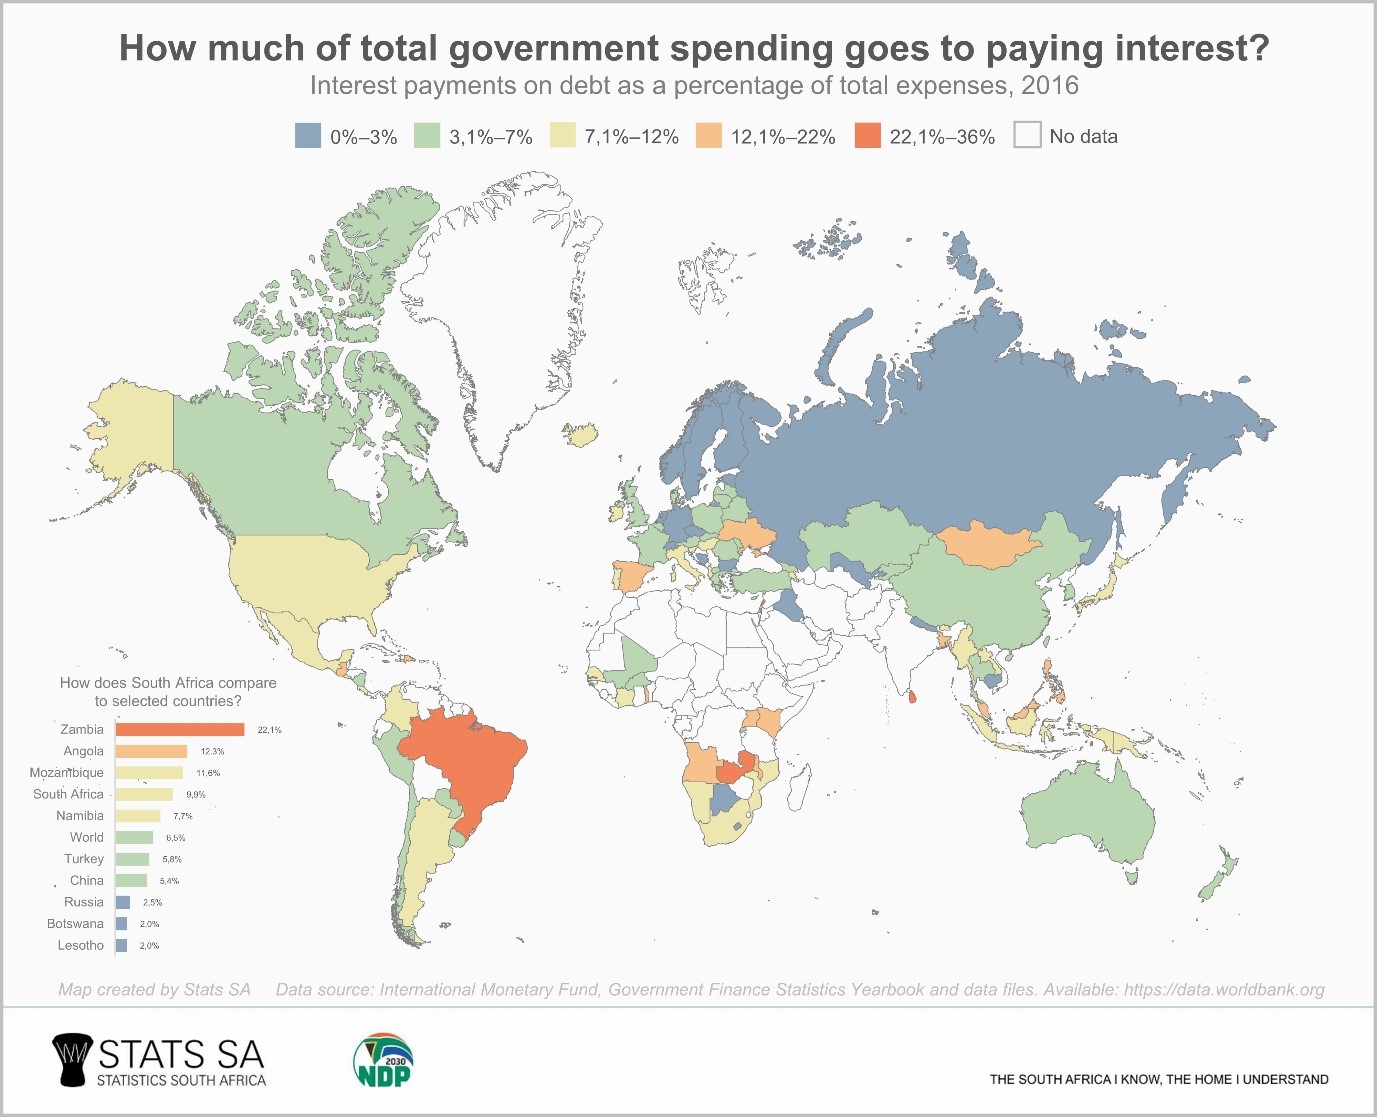
Of the 109 countries for which data are available, Lebanon, Sri Lanka, Jamaica and Brazil devoted the highest proportion of their respective budgets to interest payments in 2016. Zambia was ranked in 5th place, an indication of the country’s rapidly expanding debt burden.11 South Africa was ranked in 30th position.
South Africa has a higher interest payment burden than some of its neighbours. Namibia, Botswana and Lesotho all contribute proportionally smaller chunks of their budgets to service debt. Unfortunately, government financial data are not available for Zimbabwe, eSwatini and Madagascar, as confirmed by Open Data Watch.12
Reasonable spending and reducing South Africa’s debt were two important prescripts underlying the National Budget Speech in February.13 In the words of the Minister of Finance, if “we plant anew” seeds that will set us on the track to renewal, we will be able to return the “plum” times that we once enjoyed.
Download the Financial statistics of consolidated general government report and time series data here.
1 General government consists of 704 institutions. These include 47 national government departments, 123 provincial government departments, 257 municipalities, 251 extra-budgetary accounts and 26 higher education institutions. State-owned enterprises are not included.
2 When interpreting these figures, note that the data published in the Financial statistics of consolidated general government report (a) are adjusted for the reference period 1 April – 31 March and (b) in order to compare across all levels of government, data are converted from an accrual basis of recording system to a cash basis of recording system.
3 Stats SA, The South African economy shrinks by 0,7% (read here).
4 Stats SA, Business tax revenue struggles to recover to pre-recession highs (read here).
5 The surplus/deficit is calculated by subtracting total cash adjusted expenditure (cash payments for operating activities and purchases of non-financial assets) from total cash adjusted revenue flows.
6 National Treasury, 2019 Budget Review, Table 10 (view here).
7 Based on a total population estimate of 55,9 million for the year 2016. Stats SA, Country projections by population group, sex and age (2002-2018) [Excel file] (download here).
8 For a breakdown on what general government spent money on in 2016/17, see this Stats SA infographic. The summary table is available here.
9 National Treasury, 2019 Budget Review, Table 7.8 (view here).
10 International Monetary Fund (IMF), Government Finance Statistics Yearbook and data files. The data are available from the World Bank data portal (access the data here).
11 The Economist, Zambia slumps towards another debt crisis (read here).
13 National Treasury, 2019 Budget Speech (read here).
Similar articles are available on the Stats SA website and can be accessed here.
For a monthly overview of economic indicators and infographics, catch the latest edition of the Stats Biz newsletter here.