
Business profit jumps in financial year 2016/17
Some good news in trying times. After two consecutive years of decline, South African businesses recorded a 49% increase in net profit before tax in financial 2017, according to Stats SA’s latest Annual financial statistics (AFS) survey. The mining industry was the largest contributor to this rise.
The success of a business generally depends on earning a profit. Higher profits provide a company with the ability to expand its business, employ additional staff, and invest in non-current assets (such as buildings and equipment). The South African formal business sector1 generated R690 billion in profit in financial 2017, R228 billion more than the R462 billon recorded in financial 2016. This increase follows a two-year slump (2015–2016) that saw business profit fall by R95 billion.
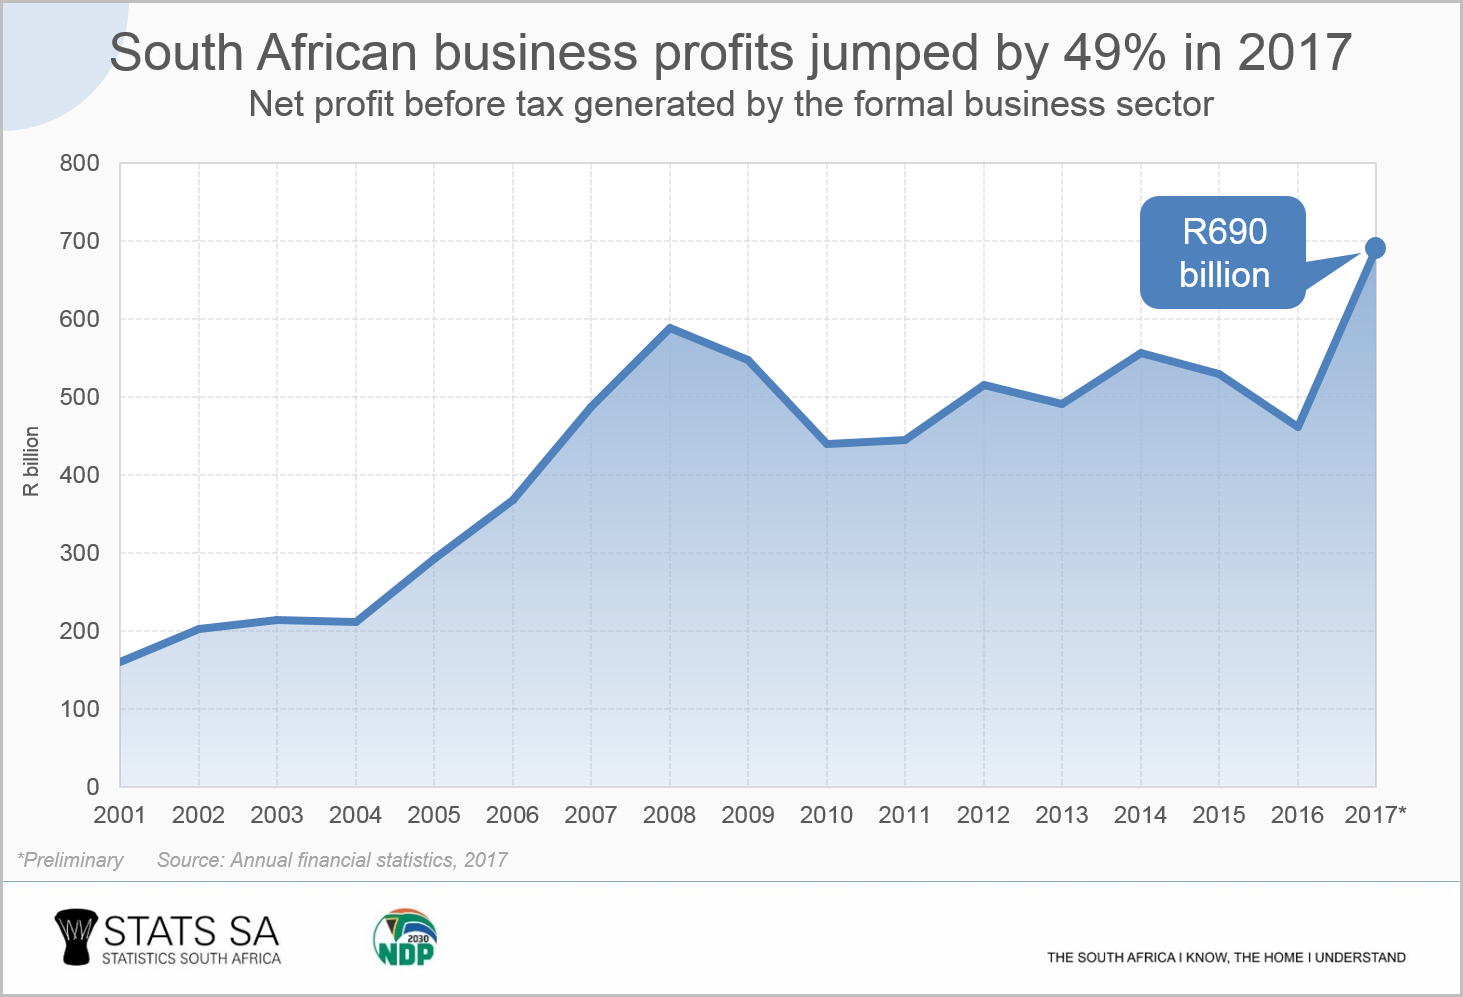
With the exception of the electricity, gas and water supply industry, all the industries covered in the AFS report saw their profits rise in 2017. The mining industry contributed the most to the R228 billion rise in 2017, increasing its own profits by R80 billion. Manufacturing contributed R69 billion and business services R38 billion.
Higher turnover, higher profits on sales of assets and lower losses on revaluation of assets were the main reasons given for the overall rise in profit in 2017.
A closer look at mining
Mining is an important player in the South African economy. The industry contributes 7% to gross domestic product (GDP)2 and employs around 450 000 people.3 In the 2015–2016 period, turnover in the mining industry grew by only R24 billion. Falling mineral prices and lower productivity (brought on by electricity shortages and industrial action) contributed to slower growth.
The problem of sluggish turnover growth during this period was compounded by higher operating costs. If total income is considered (income includes turnover and other forms of income, such as interest and dividends) the mining industry spent more than it earned in 2015 and 2016. This is in contrast to the 2001–2014 period that saw the industry spending less than the amount of income generated.
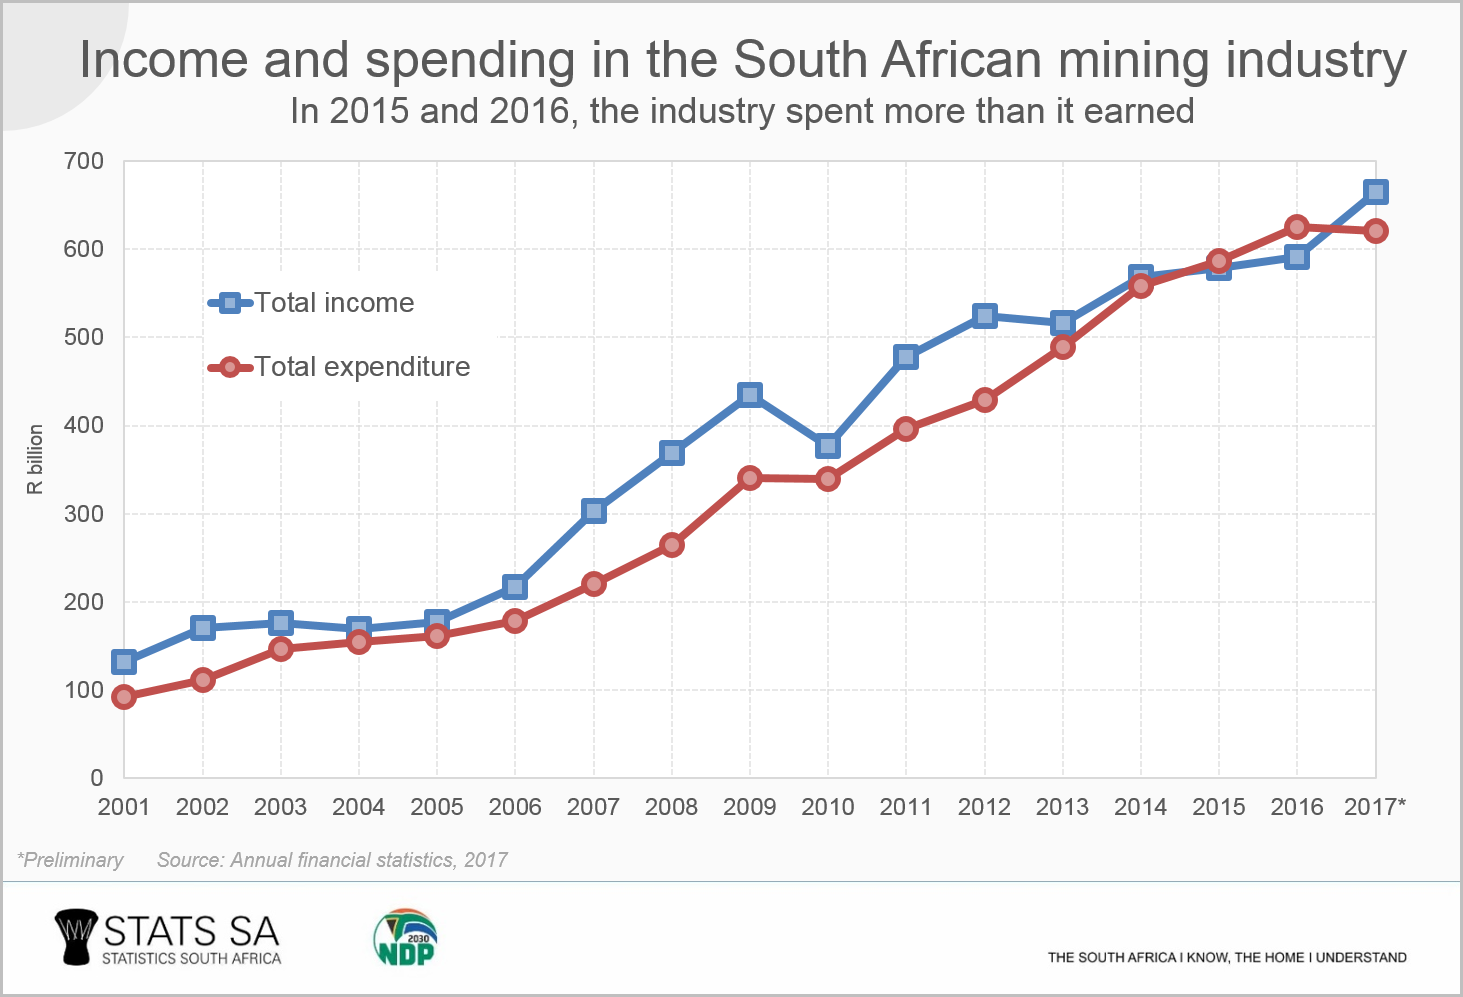
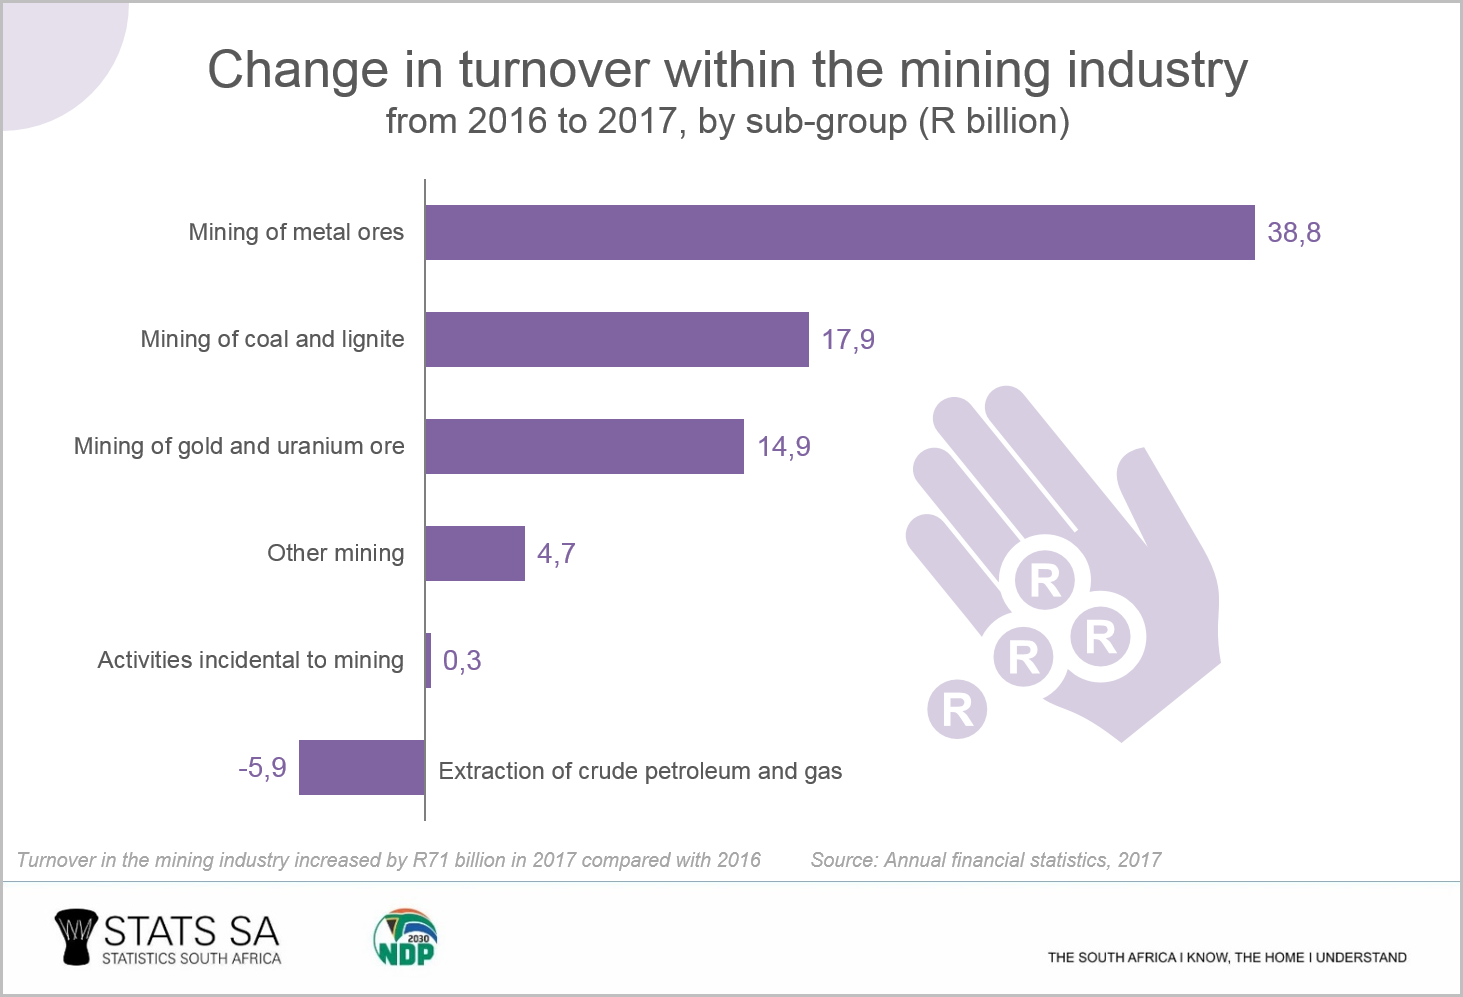
Following 2015 and 2016, the mining industry experienced a sharp rise in income in 2017. This was largely driven by a R71 billion rise in turnover. Mining of metal ores, coal and lignite, gold, and uranium ore sub-groups contributed to the increase.
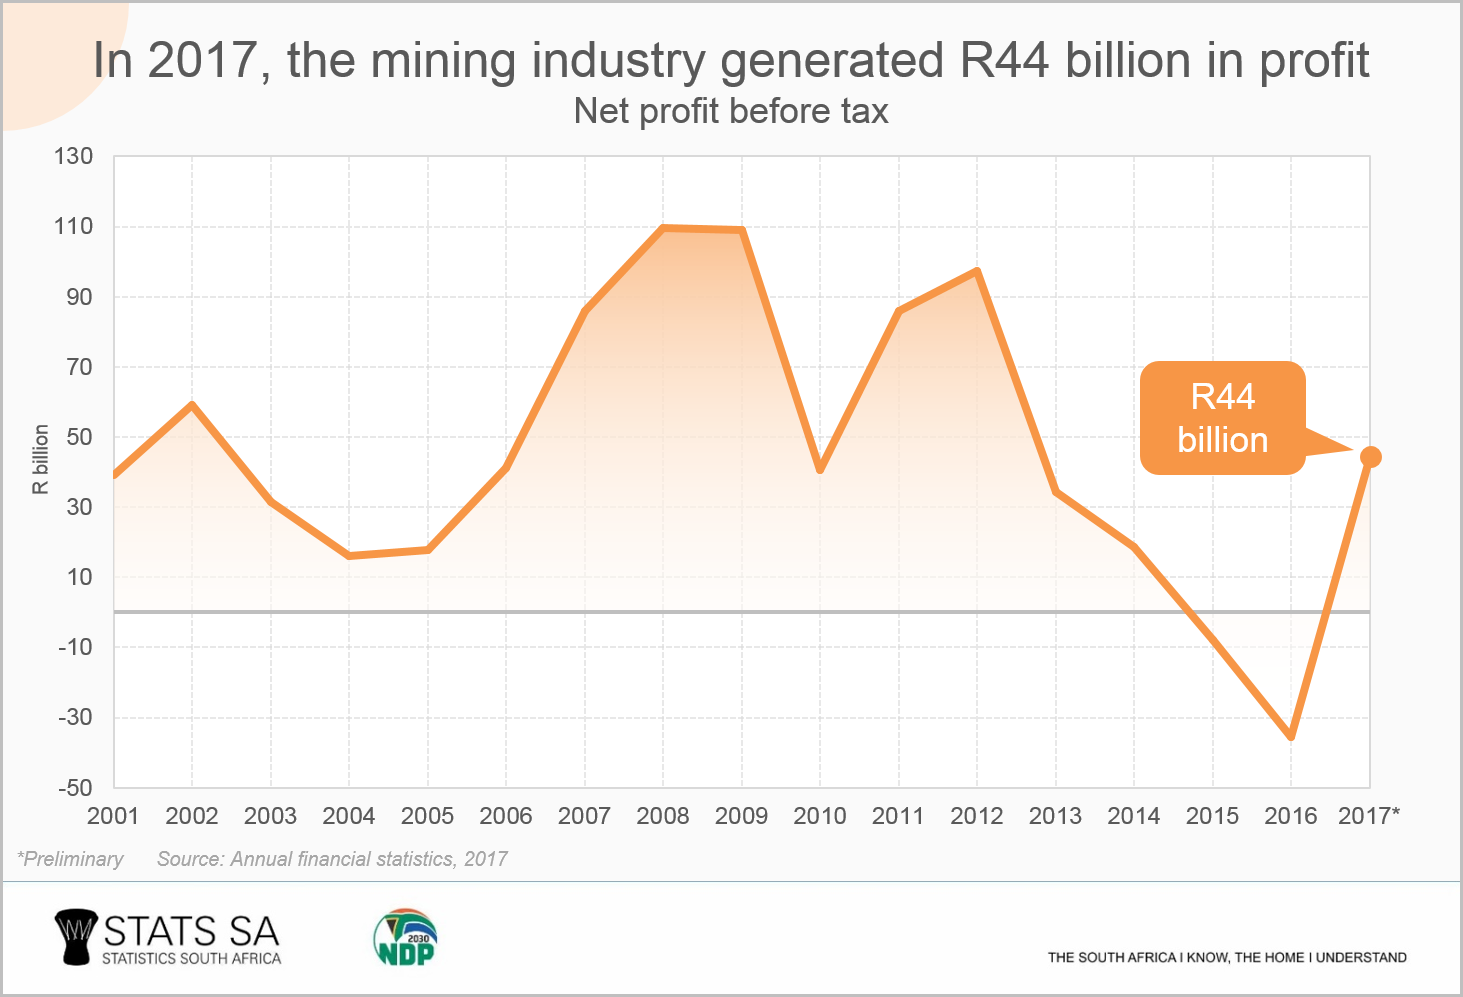
This rise in turnover was the main driver behind the rise in profit. Net profit before tax in the mining industry grew by R80 billion, from a loss of R36 billion in 2016 to a profit of R44 billion in 2017.
There was also a slight drop in spending (by 0,8% or R5 billion) in 2017 compared with 2016. The largest decrease in expenditure was seen in losses on revaluation and disposal of assets. A further decrease was seen in the losses on foreign transactions resulting from changes in foreign exchange rates.
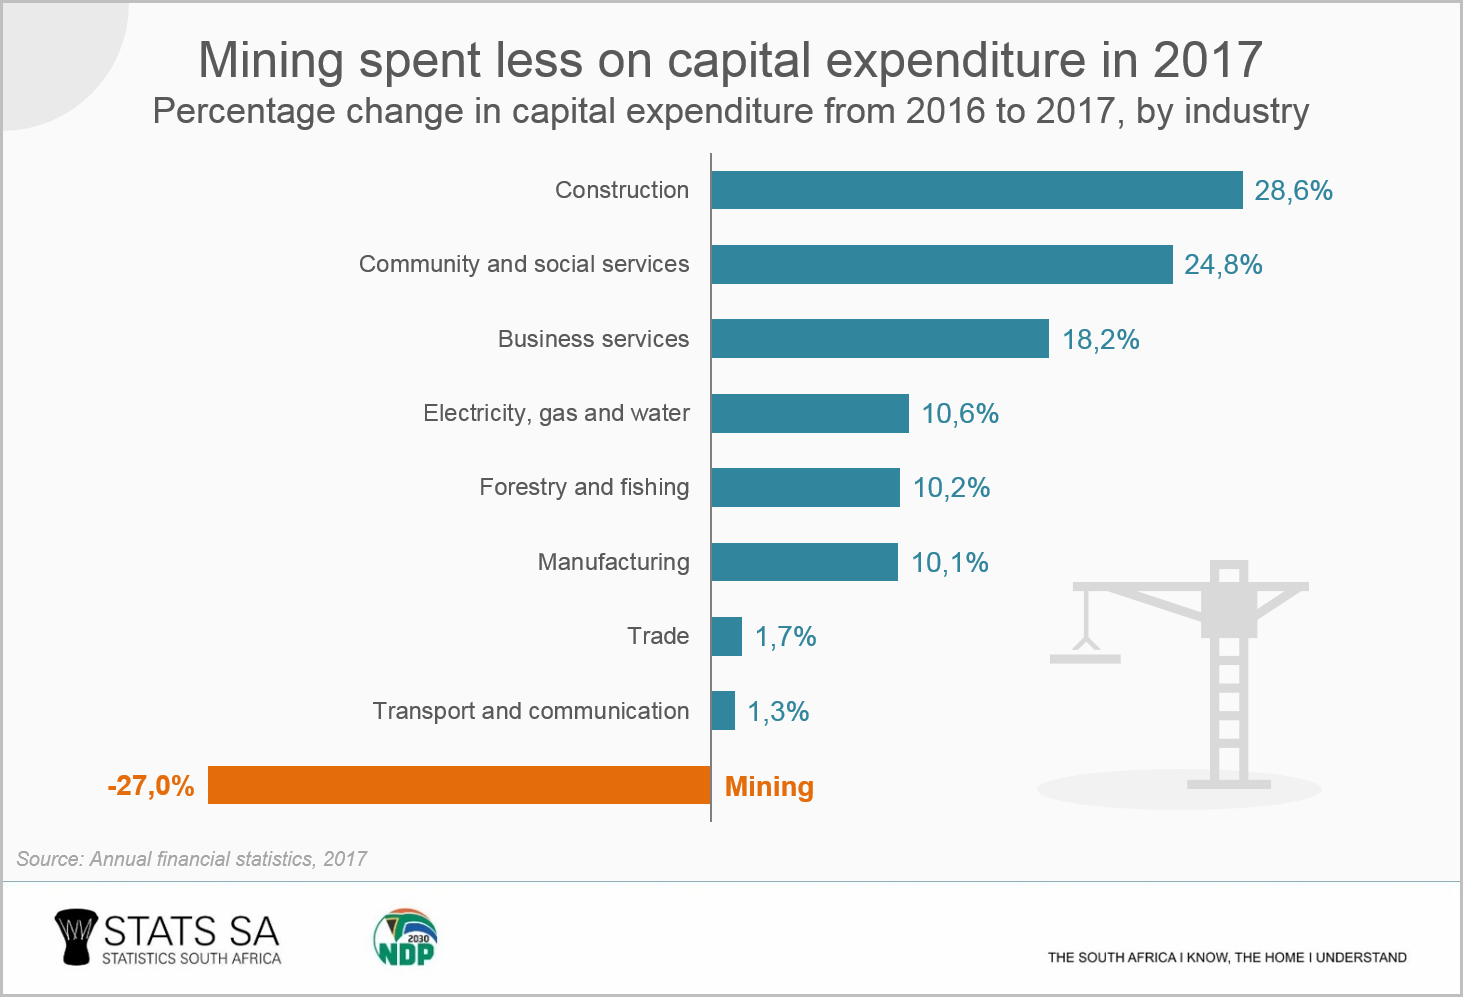
While the mining industry may have enjoyed higher profits in 2017, the losses experienced in previous years have eroded the amount of capital available to buy new assets. Mining was the only industry that reported a decrease in capital expenditure in 2017 (a fall of 27%). This is the third consecutive year of decline in capital expenditure in the mining industry, with annual decreases reported in 2016 (-9,6%) and 2015 (-0,4%).
With the recent announcement by Stats SA that South Africa has emerged from its second economic recession since 19944, all eyes will be on upcoming economic releases to see if there will be more nuggets of good news.
Download the latest Annual financial statistics (AFS) release here.
1 Formal business includes private businesses and public corporations. The AFS survey measures the financial performance and position of each industry. The report sources data from the financial statements of enterprises (i.e. private businesses and public corporations) in all industries, with the exclusion of agriculture and hunting; government and educational institutions; and financial intermediation, insurance and business services not elsewhere classified. The AFS 2017 survey information was collected for the financial years of enterprises that ended on any date between 1 July 2016 and 30 June 2017.
2 Stats SA, Gross domestic product (GDP), 2nd quarter 2018, Media presentation, slide 14 (view here).
3 Stats SA, Quarterly Employment Statistics (QES), June 2018, Table A (view here).
4 Stats SA, The recession ends as GDP climbs by 2,2% (read here).
Similar articles are available on the Stats SA website and can be accessed here.
For a monthly overview of economic indicators and infographics, catch the latest edition of the Stats Biz newsletter here.