
General government spending slows in 2016/17
Indicative of an economy under strain, expenditure by general government increased by just 4,7% from 2015/16 to 2016/17. This is the lowest annual rise in spending on record since 2005/06, when Stats SA started publishing the current series of its Financial statistics of consolidated general government report. The latest financial data provide an updated picture of what our government spends money on.

There are 704 institutions that make up general government. This includes all national and provincial government departments, municipalities, extra-budgetary accounts and higher education institutions.1
General government spent R1,58 trillion in 2016/17, higher than the R1,51 trillion recorded in 2015/16. A 3,1% fall in capital expenditure contributed to the slower growth in overall spending. This mirrors a similar result published in Stats SA’s recent Capital expenditure by the public sector release, which reported a pull-back in spending on capital expenditure throughout the public sector in 2017.2
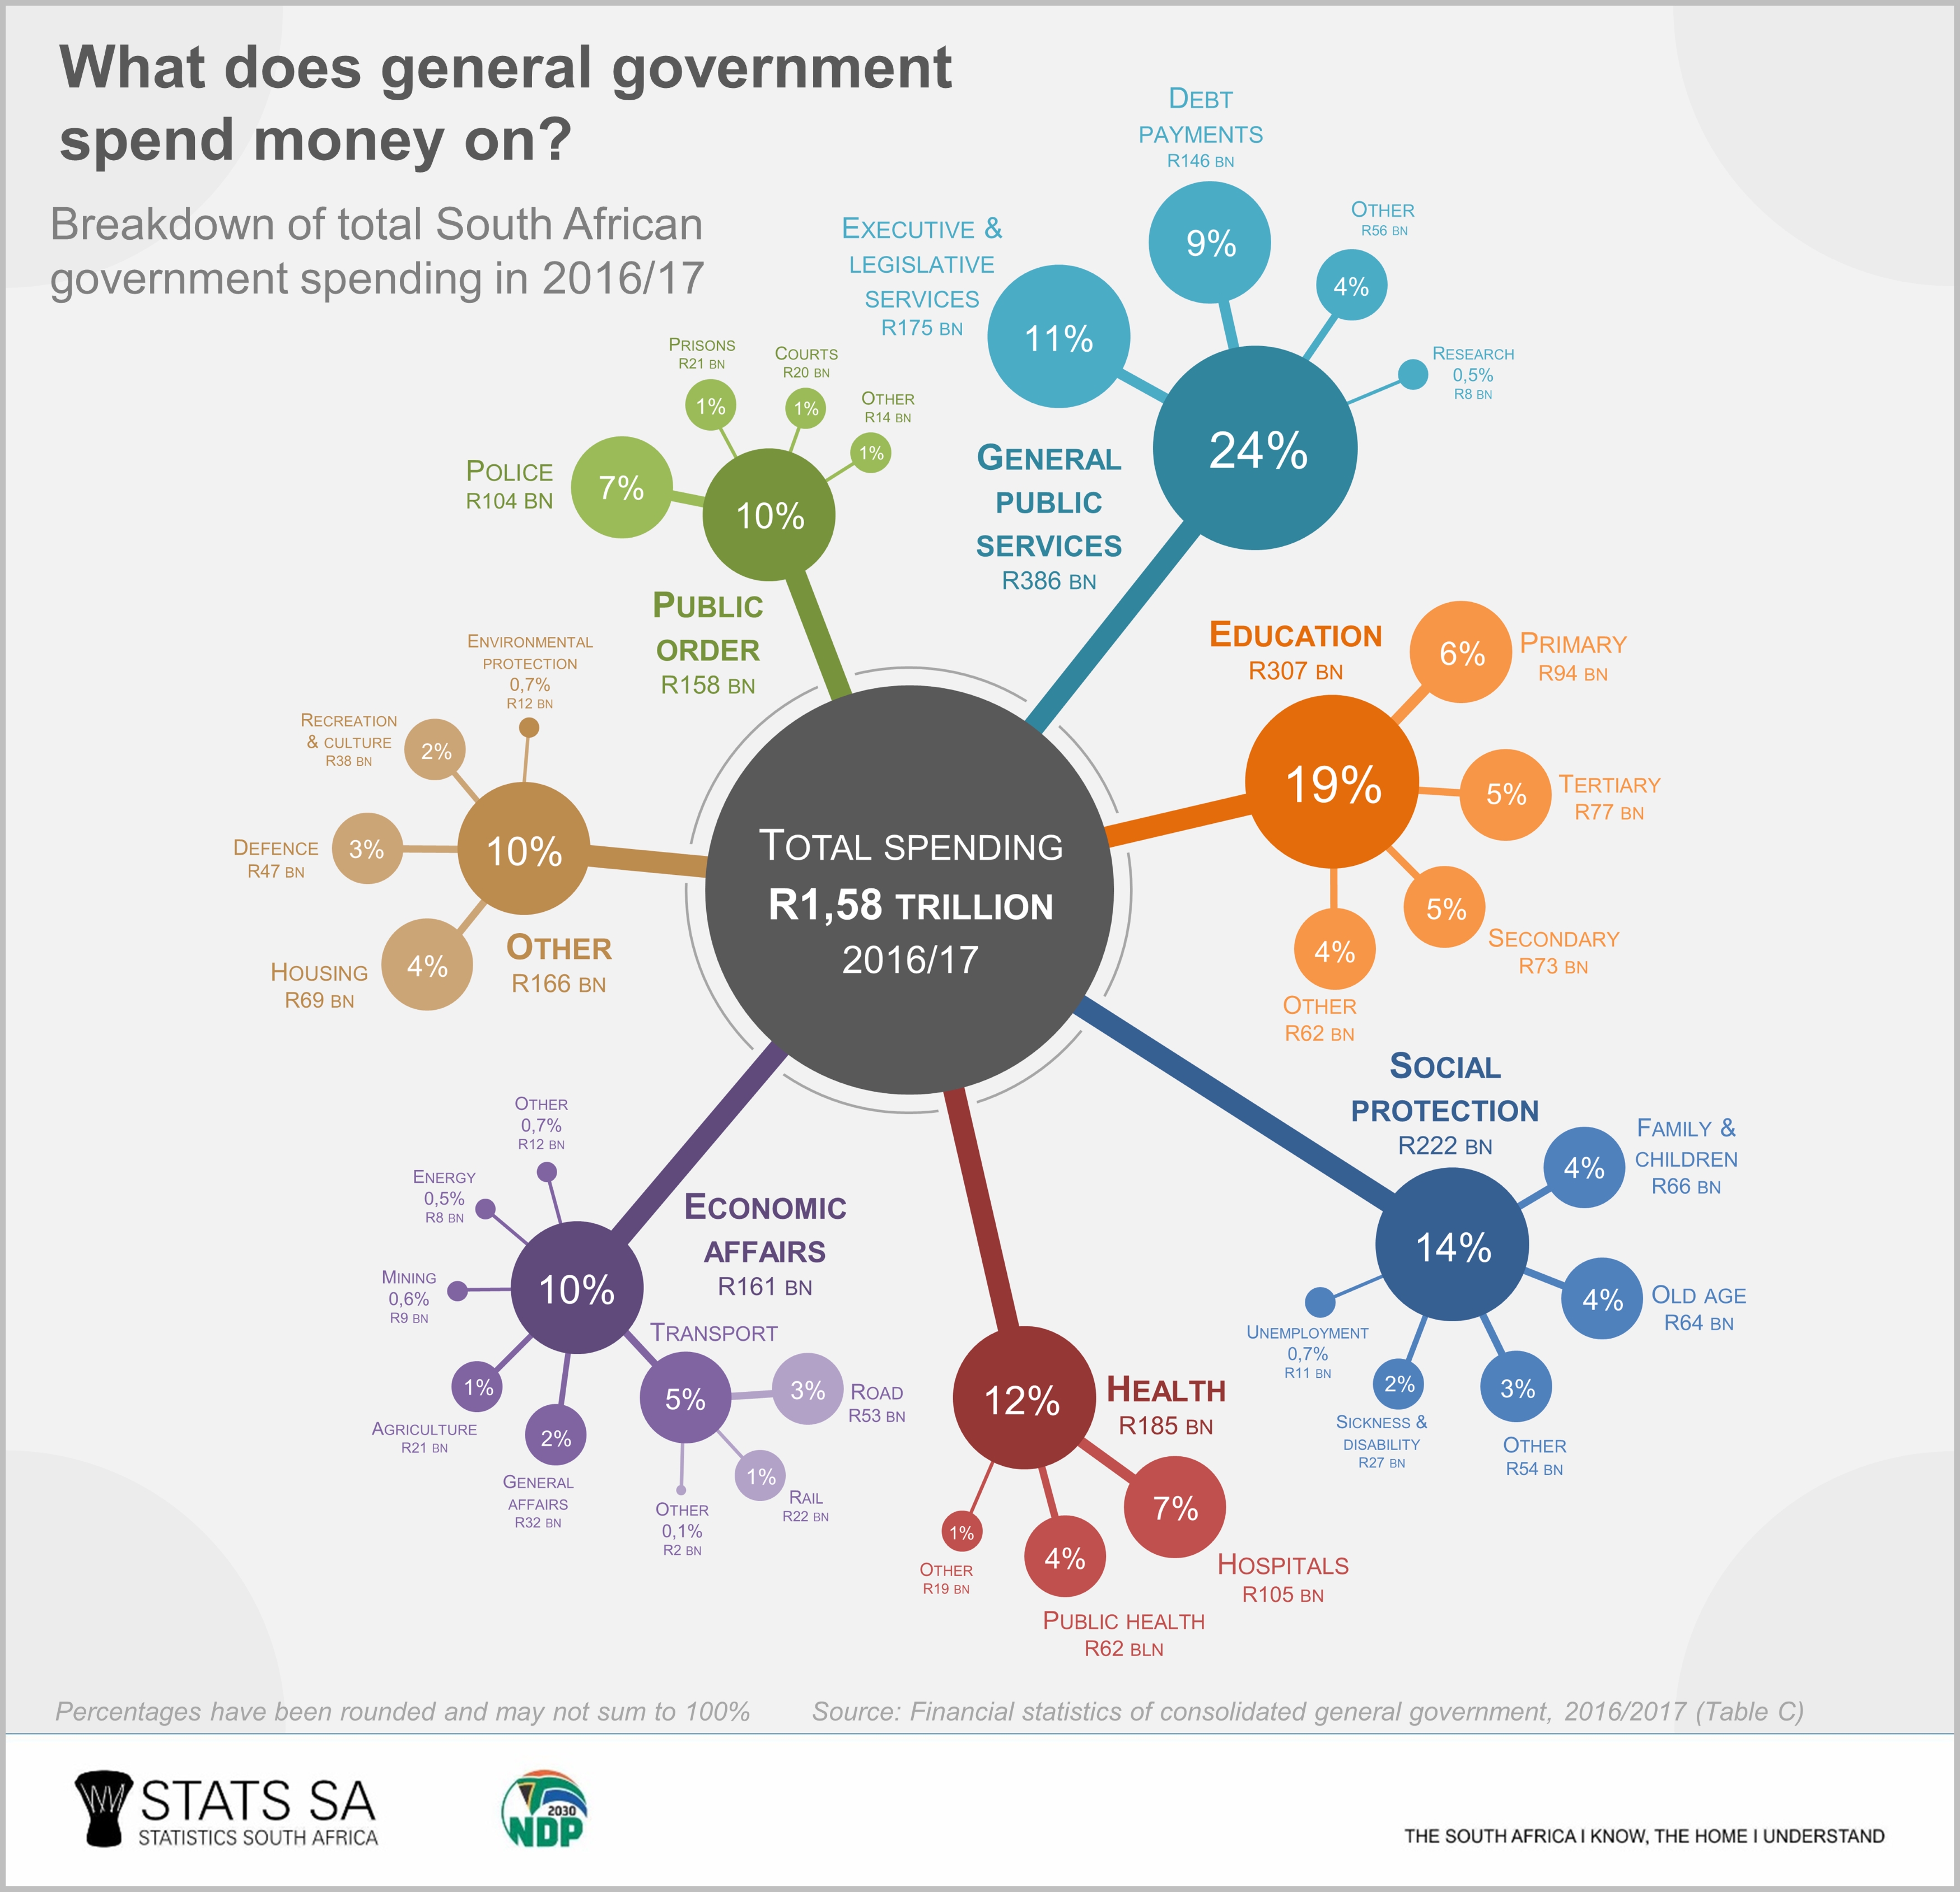
The infographic below shows a breakdown of what government’s spending priorities were in the 2016/17 fiscal year. The bulk of general government expenditure was on the following four functions: general public services (24%); education (19%); social protection (14%); and health (12%).
Unpacking some of the expenditure on other functions, it is evident that more money was spent on police services (R104 billion) than on housing (R69 billion) in 2016/17. Payments on public debt, under general public services, totalled R146 billion or 9% of total expenditure, higher than the amount spent on hospital services (R105 billion) or tertiary education (R77 billion) (click on the image to enlarge).
Another way to analyse government spending is to express it in economic terms, which provides insight into how much money was paid towards items such as goods, services, and salaries. Compensation of employees, which includes salaries and wages earned by civil servants, took up the lion’s share (42%) of total expenses.3 This was followed by purchases of goods and services, social benefits, and interest paid.
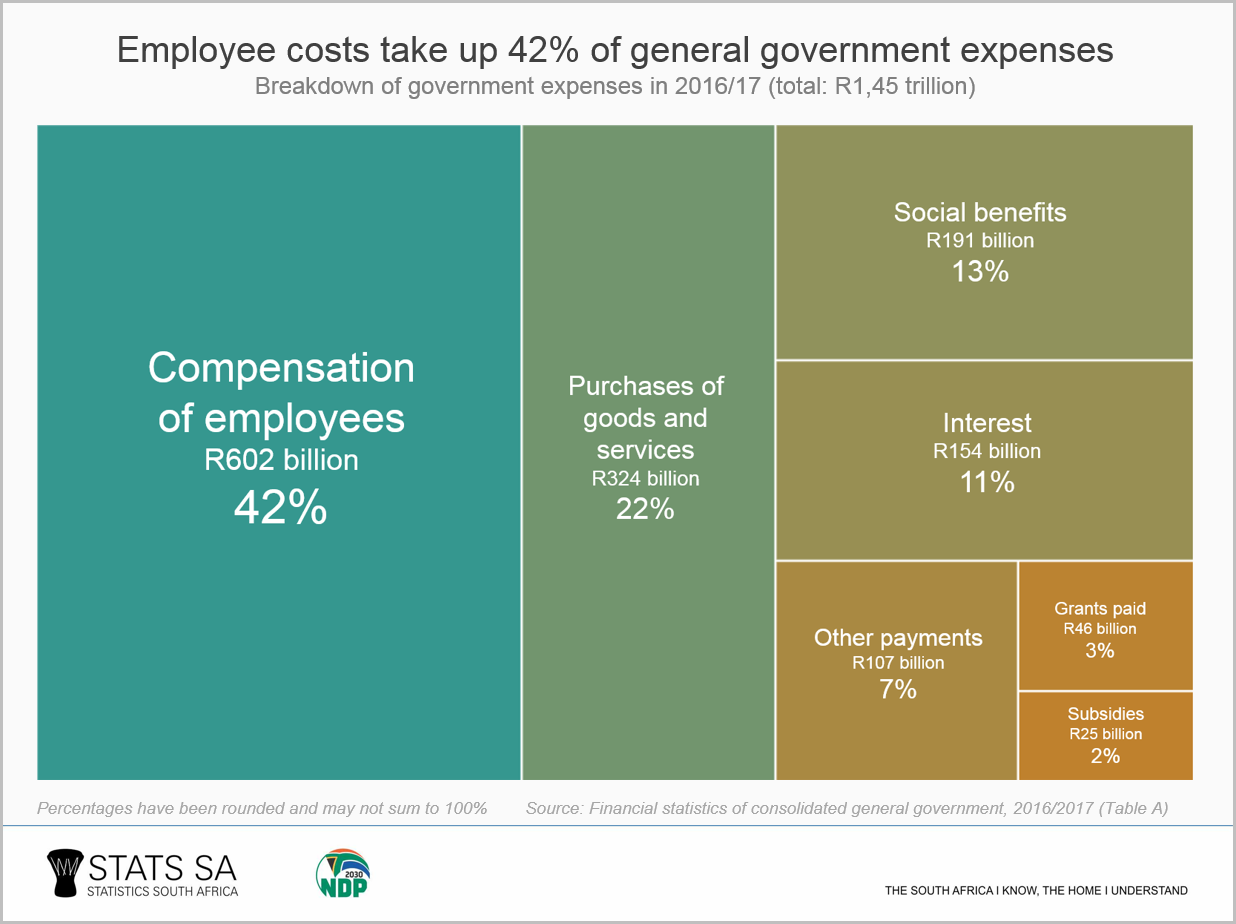
Compensation of employees, purchases, interest, subsidies and social benefits increased in 2016/17 compared with 2015/16. The general government’s wage bill increased by 8% (or R44 billion), with an increase of 8% for national government, 8% for provincial government, 9% for extra-budgetary institutions, and 9% for higher education institutions.
However, there was a fall in spending on grants paid and other payments. Government transferred less money to the Southern African Customs Union (SACU) in 2016/17 compared with 2015/16 as a result of lower customs duties, contributing to the fall in grants paid.
Download the Financial statistics of consolidated general government 2016/2017 release here. The report measures the impact of both the economic and functional effect of general government spending, gauging the extent of the cost of certain functions (for example, health, education, defence) against their economic impacts (for example, compensation of employees and interest paid). The report adheres to the 2014 Government Finance Statistics Manual (GFSM).
1 The 704 institutions covered in the report include 47 national government departments, 123 provincial government departments, 257 municipalities, 251 extra-budgetary accounts and 26 higher education institutions.
2 Stats SA, Public-sector capital expenditure shrinks for the first time since 2010 (read here).
3 Total expenses exclude capital expenditure.
Similar articles are available on the Stats SA website and can be accessed here.
For a monthly overview of economic indicators and infographics, catch the latest edition of the Stats Biz newsletter here.