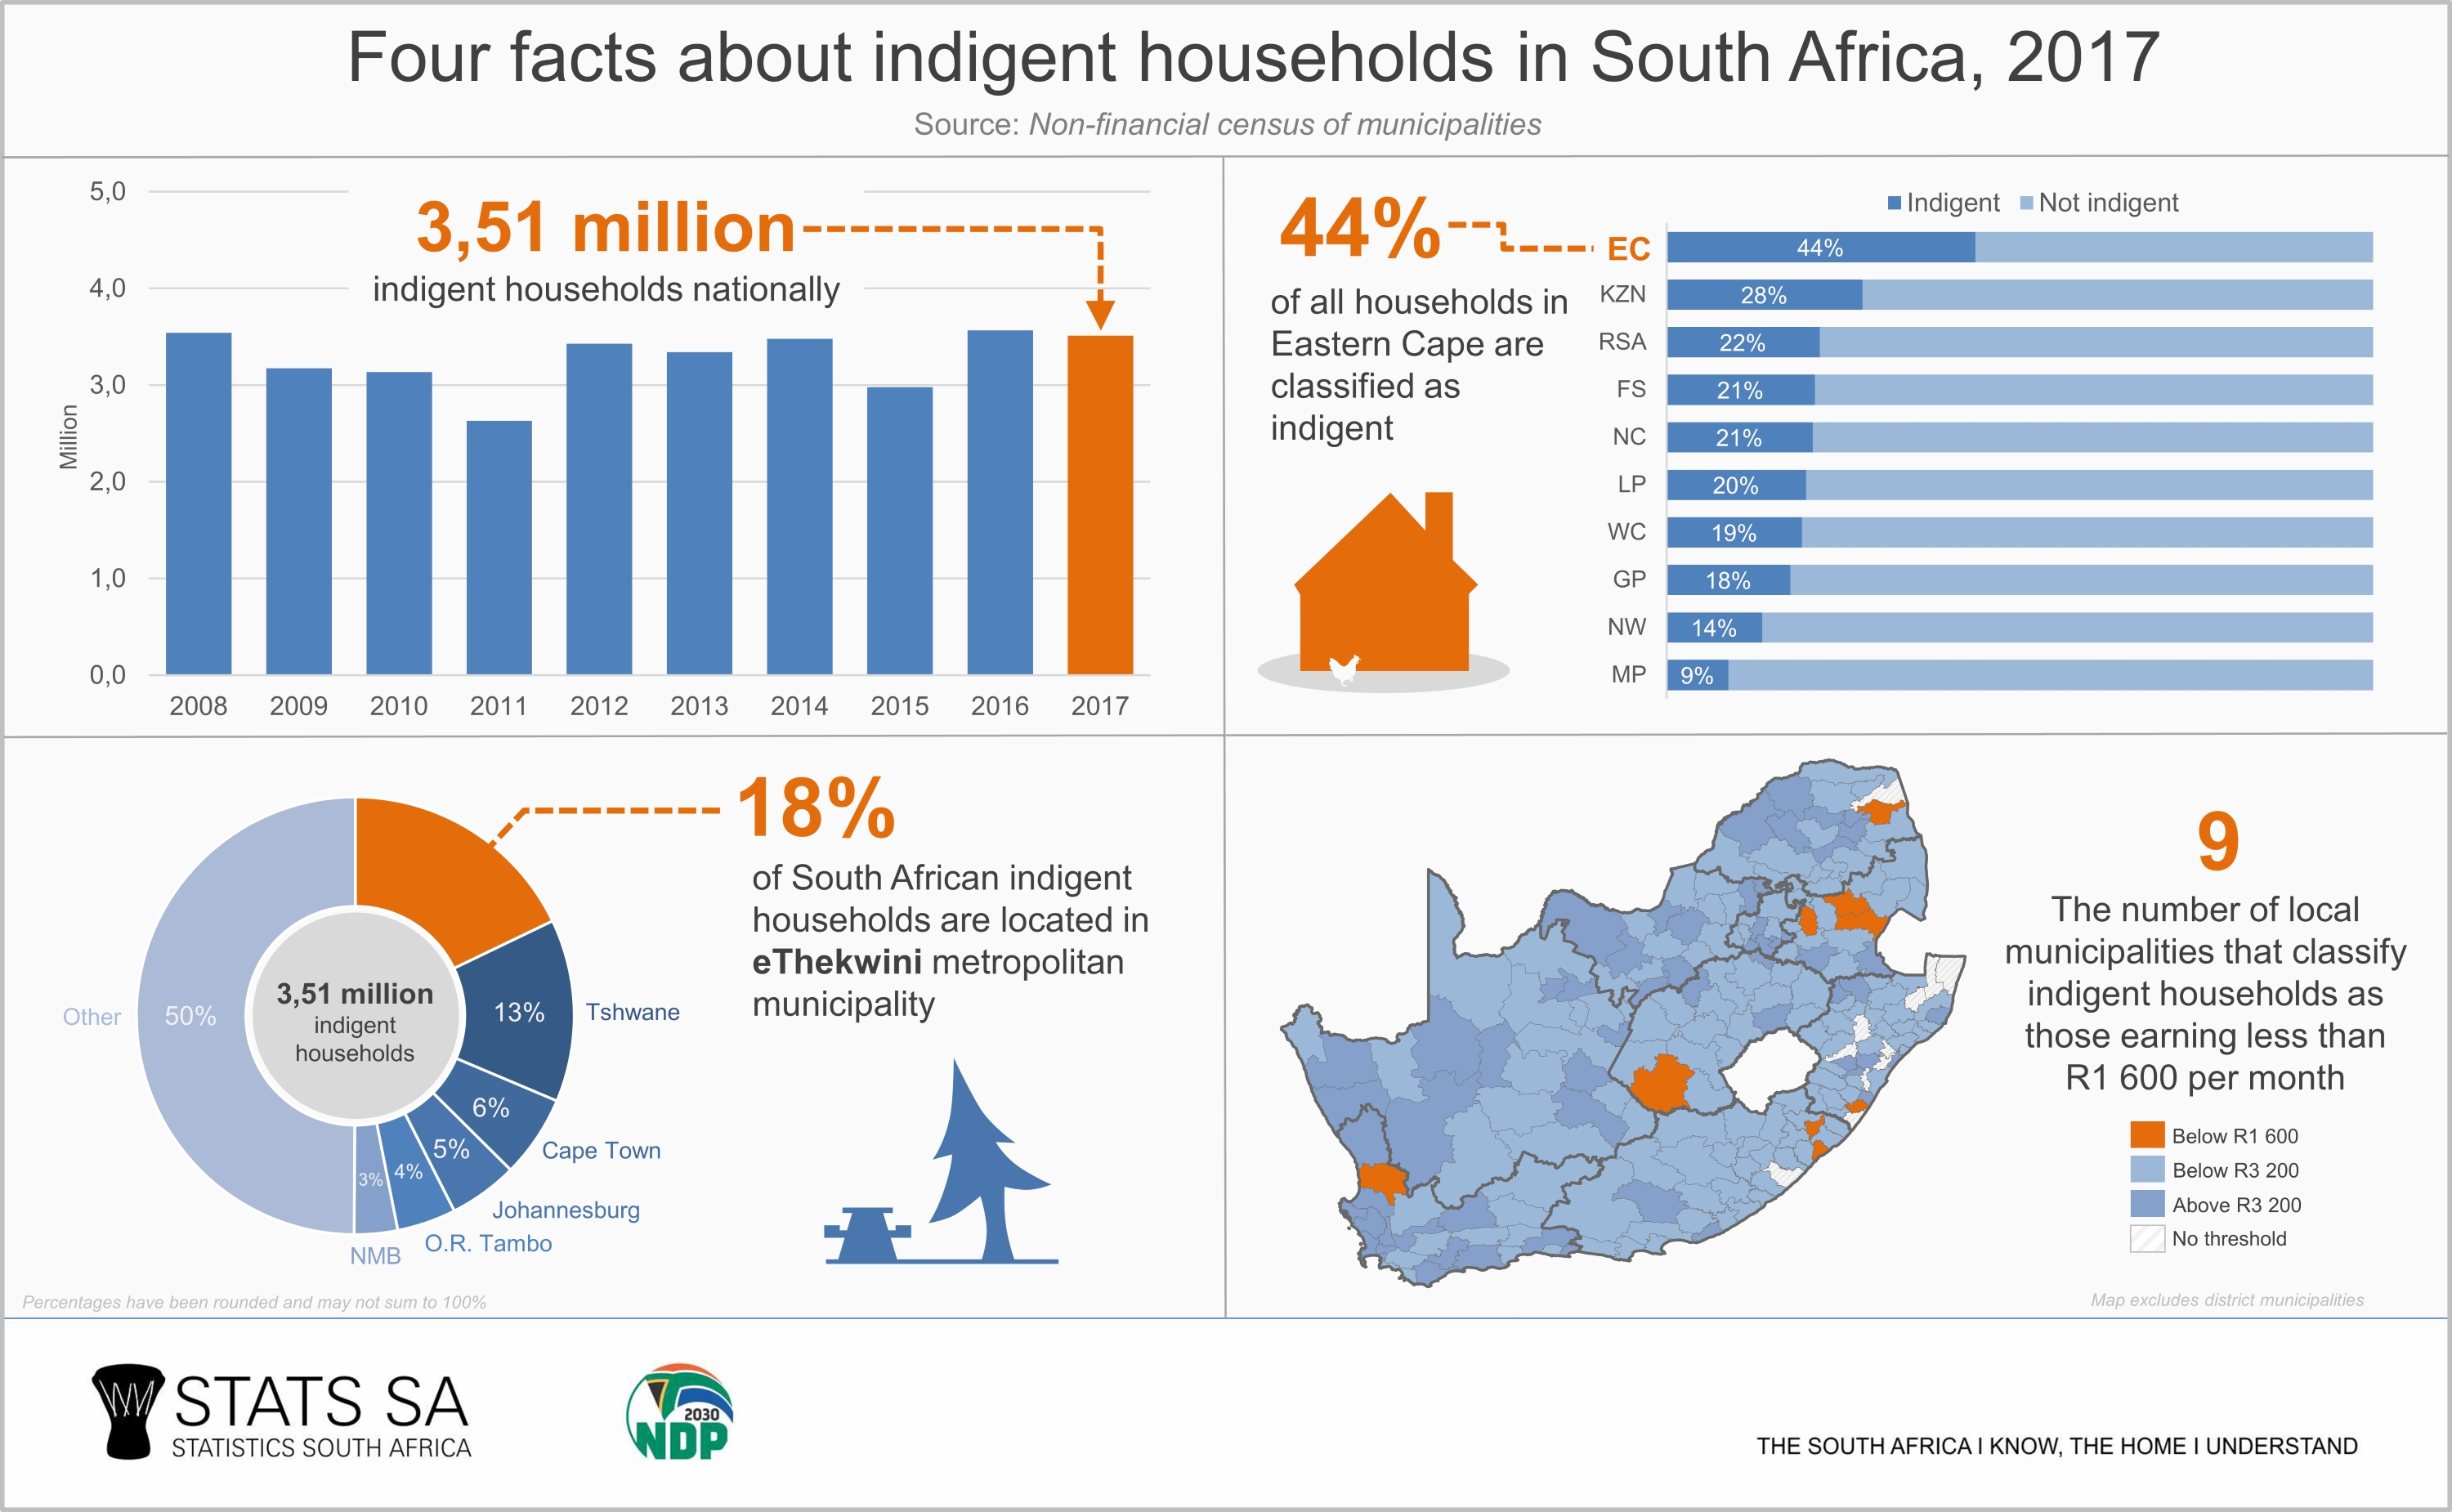
Four facts about indigent households
If South Africa were a suburb of 100 households, 22 would be beneficiaries of government’s indigent programme. Stats SA’s recent Non-financial census of municipalities provides insight into those households that struggle to afford access to basic services.
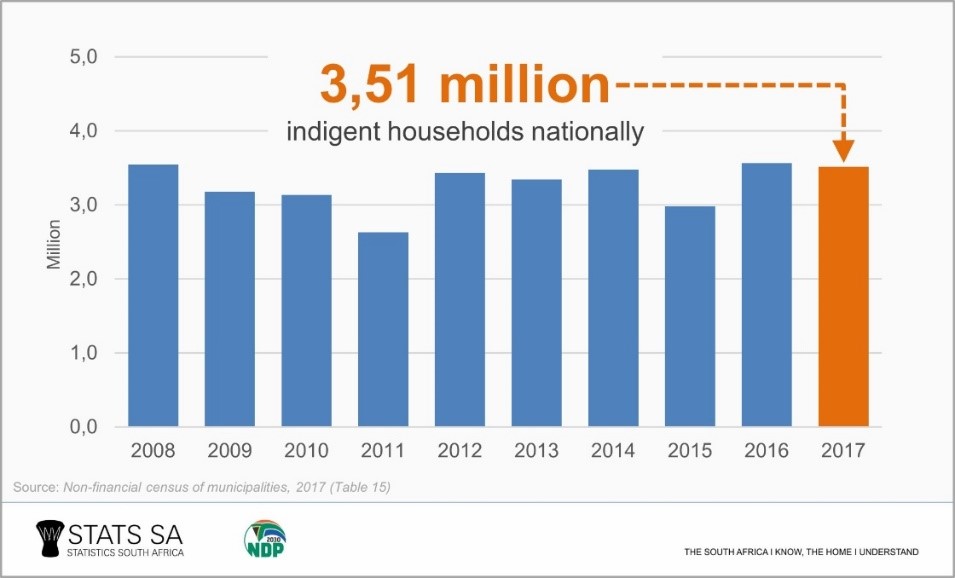
Fact 1: 22% of households are classified as indigent
In 2001 South Africa adopted a policy intended for the provision of free basic services to poorer households. Under this policy, municipalities were tasked to identify indigent households that would receive services – such as water and electricity – for free or at substantially subsidised rates.
South Africa’s 257 municipalities registered 3,51 million indigent households in 2017.1 That’s about 1 in every 5 of the country’s 16,2 million2 households (click on the image to enlarge).
Households are required to register with municipalities to qualify for free basic services. A municipality’s role is to vet every application, selecting only those households that meet various criteria. Successful applicants are granted indigent status. Municipalities often run awareness campaigns to ensure that households are aware of the application process.
Indigent status isn’t for life, however. The economic status of a family might improve over time. To ensure that only the poorest families are catered for, municipalities require registered households to reapply for indigent status on a regular basis, often once a year.
There are constraints. A municipality might not be able to service all indigent households that have successfully registered, due to lack of funds or inadequate infrastructure.
Fact 2: Eastern Cape has the widest coverage
Municipalities in Eastern Cape registered almost 730 000 indigent households in 2017, comprising 44% of all households in that province.
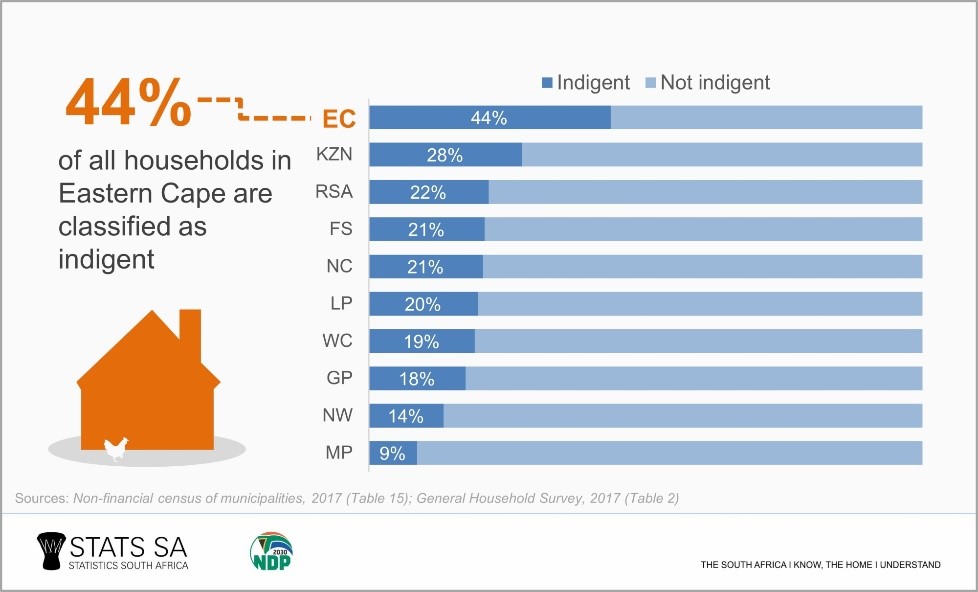
The municipalities with the highest number of indigent households in Eastern Cape were O.R. Tambo District Municipality (153 000 households) and Nelson Mandela Bay (112 419 households).
Fact 3: eThekwini has the largest number of indigent households
Half of South Africa’s 3,51 million indigent households were located in just six municipalities. eThekwini was home to about 627 000 indigent households, comprising 18% of the national tally.
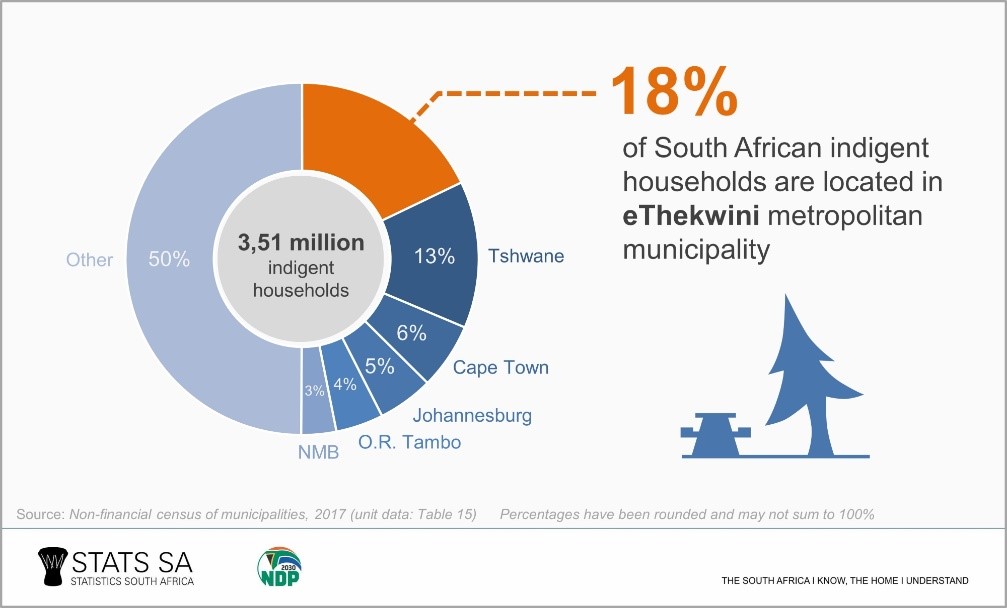
Tshwane had the second highest number (474 035 households), followed by Cape Town (213 424 households) and Johannesburg (178 599 households).
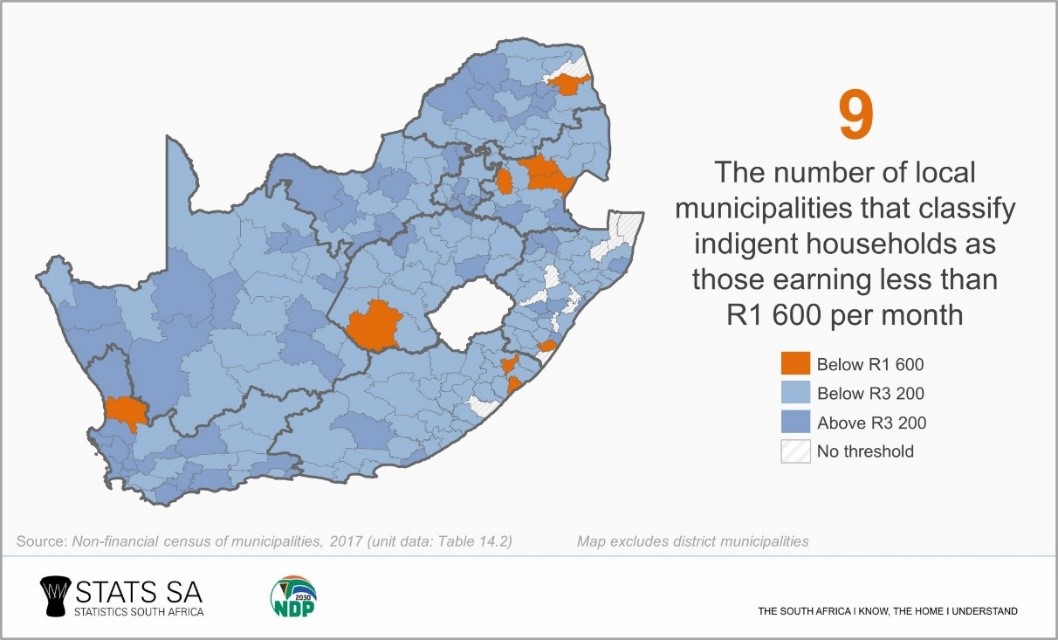
Fact 4: It is up to municipalities to determine who is indigent
Municipalities determine their own criteria for identifying and registering indigents. To a large extent, this determination is based on the resources available to the municipality.
In 2017 most municipalities (147 out of 257) classified an indigent household as a family earning a combined income of less than R3 200 per month. Eleven municipalities (nine local municipalities and two district municipalities) adopted a lower income poverty threshold of R1 600 per household per month.
Municipalities can also decide on the extent to which they subsidise an indigent household. The general rule is that indigent households are entitled to 6 kl of free water per household per month and 50 kWh of free electricity per household per month.3 The extent to which sanitation and refuse removal services are subsidised varies from municipality to municipality.
The provision of basic services to the poor remains a top priority for government. With over half of South Africa’s population in poverty,4 and with the economy in recession in the first half of 2018, the indigent programme continues to be a vital lifeline for the 22% of households that would otherwise not have had access to basic services.
1 Visit the download page for the latest Non-financial census of municipalities report here to access the PDF report and Excel file with municipal (unit) data. The data used in this article are available in Table 14.2 and Table 15.
2 Stats SA, General Household Survey (GHS), 2017, Table 2 (download here).
3 Department of Provincial and Local Government, National Framework for municipal indigent policies, page 16 (download here).
4 As per the upper-bound poverty line. An overview of the latest poverty figures are available here.
Similar articles are available on the Stats SA website and can be accessed here.
For a monthly overview of economic indicators and infographics, catch the latest edition of the Stats Biz newsletter here.