Higher education continues to cut capital spending
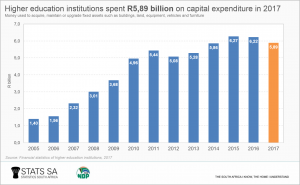
Capital expenditure by South Africa’s higher education institutions continued to fall, for the second consecutive year. The country’s 20 universities and 6 universities of technology recorded a 5,4% drop in capital expenditure in 2017 compared with 2016, falling from R6,22 billion to R5,89 billion.
This followed a 0,7% drop in 2016, according to Stats SA’s recent Financial statistics of higher education report.1
Capital expenditure is money that an institution spends to acquire, maintain or upgrade fixed assets such as buildings, land, equipment, vehicles and furniture. These assets generally increase the capacity and efficiency of the institution, and usually have a life span of longer than a single accounting period. The amount that an institution spends on fixed assets shows the extent to which it’s investing in the long term.
The drop in higher education capital expenditure mirrors the pull-back in spending on fixed assets by the public sector. Stats SA’s Capital expenditure by the public sector report for 2017,2 drawing on financial data from 751 institutions, recorded the first annual decline in public-sector capital expenditure since 2010. Subdued spending on plant, machinery, new construction works and transport equipment was largely the cause of the fall.
In terms of higher education, the 5,4% drop in 2017 was largely a result of decreased spending by the University of the Witwatersrand (Wits), the University of South Africa (Unisa) and the Walter Sisulu University. These three institutions spent less on buildings, transport equipment, office furniture and other machinery and equipment.
Who were the biggest spenders on fixed assets in 2017? The University of Pretoria took the lead, contributing R738 million (or 13%) to total higher education capital expenditure. Stellenbosch University and the University of Mpumalanga took second (10%) and third (9%) spots, respectively.
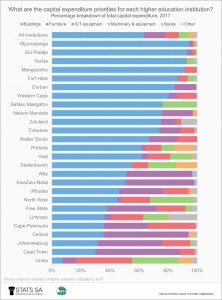
The bulk of capital expenditure (63%) was directed towards the construction and maintenance of buildings such as laboratories, lecture halls and residences. The second most important item was furniture, taking up 14% of the R5,89 billion (click on the chart to enlarge).
Capital expenditure priorities differ across institutions. The University of Mpumalanga spent 95% of its capital expenditure on buildings, while Sol Plaatje University spent 93%. In contrast, Unisa spent a small proportion on buildings, instead focussing on ICT equipment and machinery and equipment.
The decrease in overall capital expenditure can be attributed to various reasons. Wits, for example, indicated that it had reduced capital expenditure in order to conserve money for increased maintenance costs. The institution would also redirect any surplus cash towards its insourcing programme, the process of absorbing staff that were previously employed by third-party contractors.3
1 Download the latest Financial statistics of higher education here.
2 Stats SA, Public-sector capital expenditure shrinks for the first time since 2010 (read here).
3 University of the Witwatersrand, 2017 Annual Report, pages 63 (download here).
Similar articles are available on the Stats SA website and can be accessed here.
For a monthly overview of economic indicators and infographics, catch the latest edition of the Stats Biz newsletter here.


