
How much does SA business spend on its employees?
About 14% of total spending, according to recent figures. A quick review of the data shows that this proportion has remained relatively stable over the last decade. In the second quarter of 2009, employment costs contributed 15% of total expenditure in the formal business sector. Although there hasn’t been a major change over time for the sector as a whole, there are notable differences between industries.
Let’s take a look at the breakdown of total spending.
The formal business sector1 spent a total of R2,39 trillion in the second quarter of 2018, according to the latest Quarterly financial statistics (QFS) report (excluding capital expenditure). A rundown of the expenditure data, collected from a sample of about 4 500 businesses, shows that 60% was spent on purchases of goods such as raw materials, consumables, goods for resale, fuel and building materials.
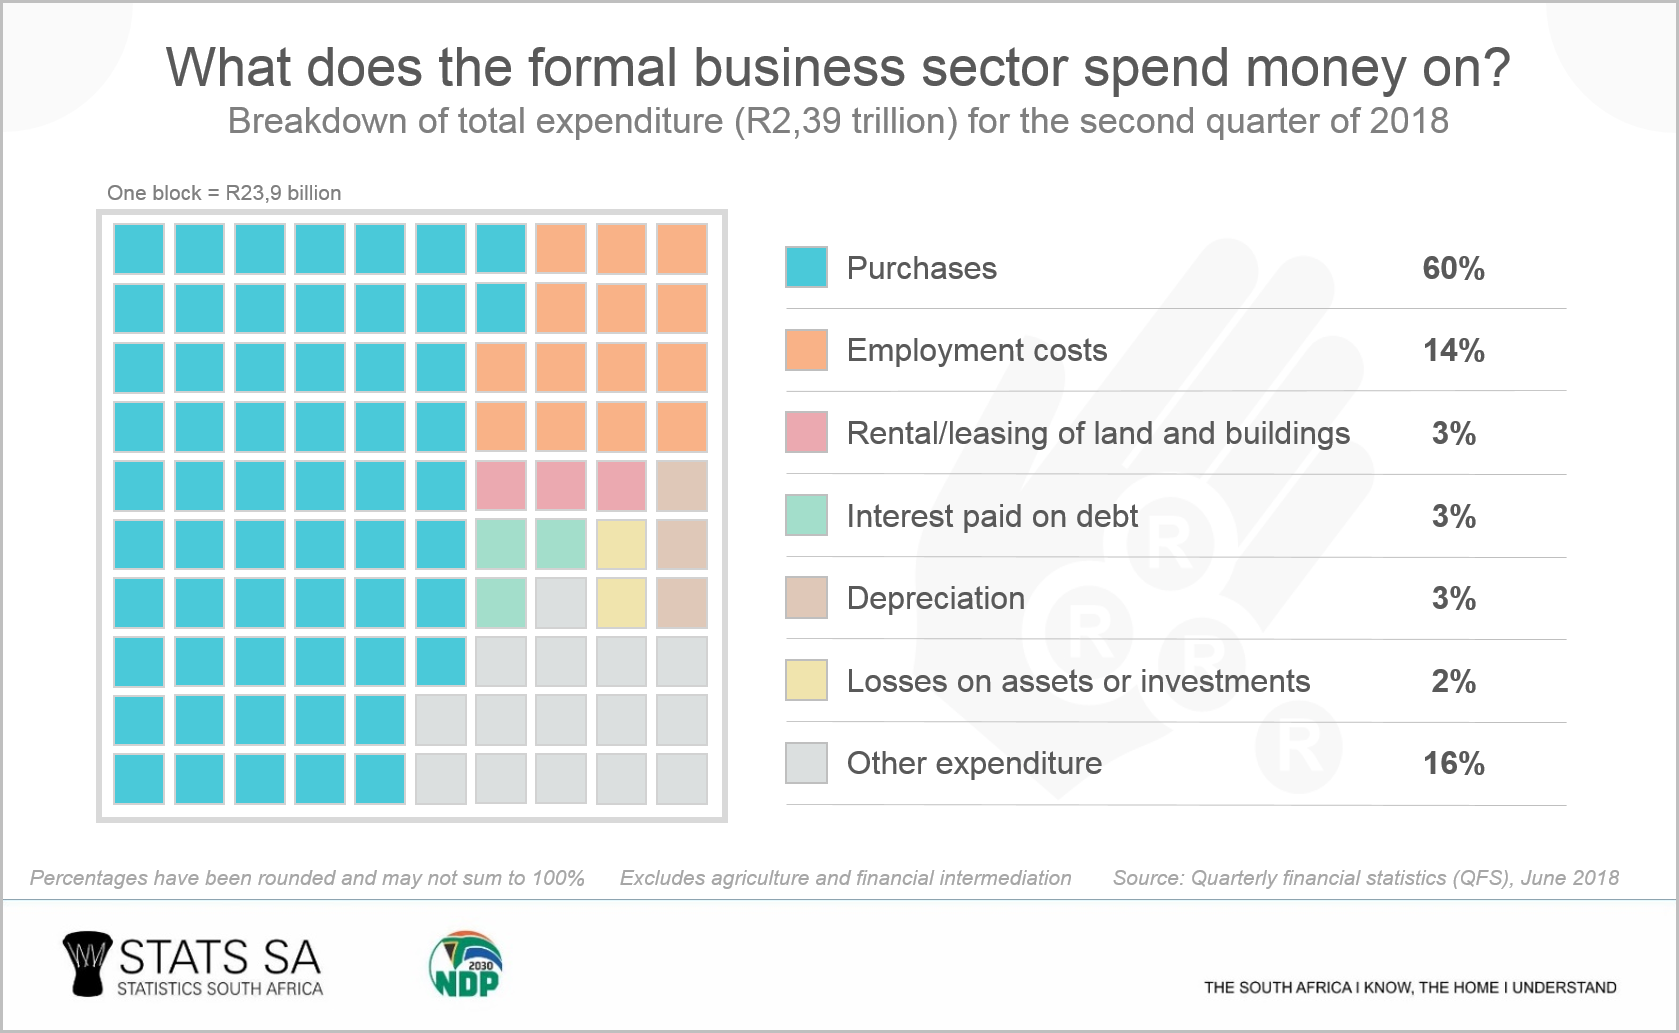
Employment costs, as mentioned earlier, contributed 14% (or R340 billion). The bill here includes salaries and wages, bonuses, medical aid, life insurance benefits, pension benefits, and other employee-related costs.
How do employment costs differ across industries?
The QFS provides data for eight industries in the formal business sector. The community, social and personal services industry recorded the highest proportion of spending on employment costs (32%) in the second quarter of 2018. Community, social and personal services includes activities related to private health services and social work, recreational activities, sport, radio, and television.
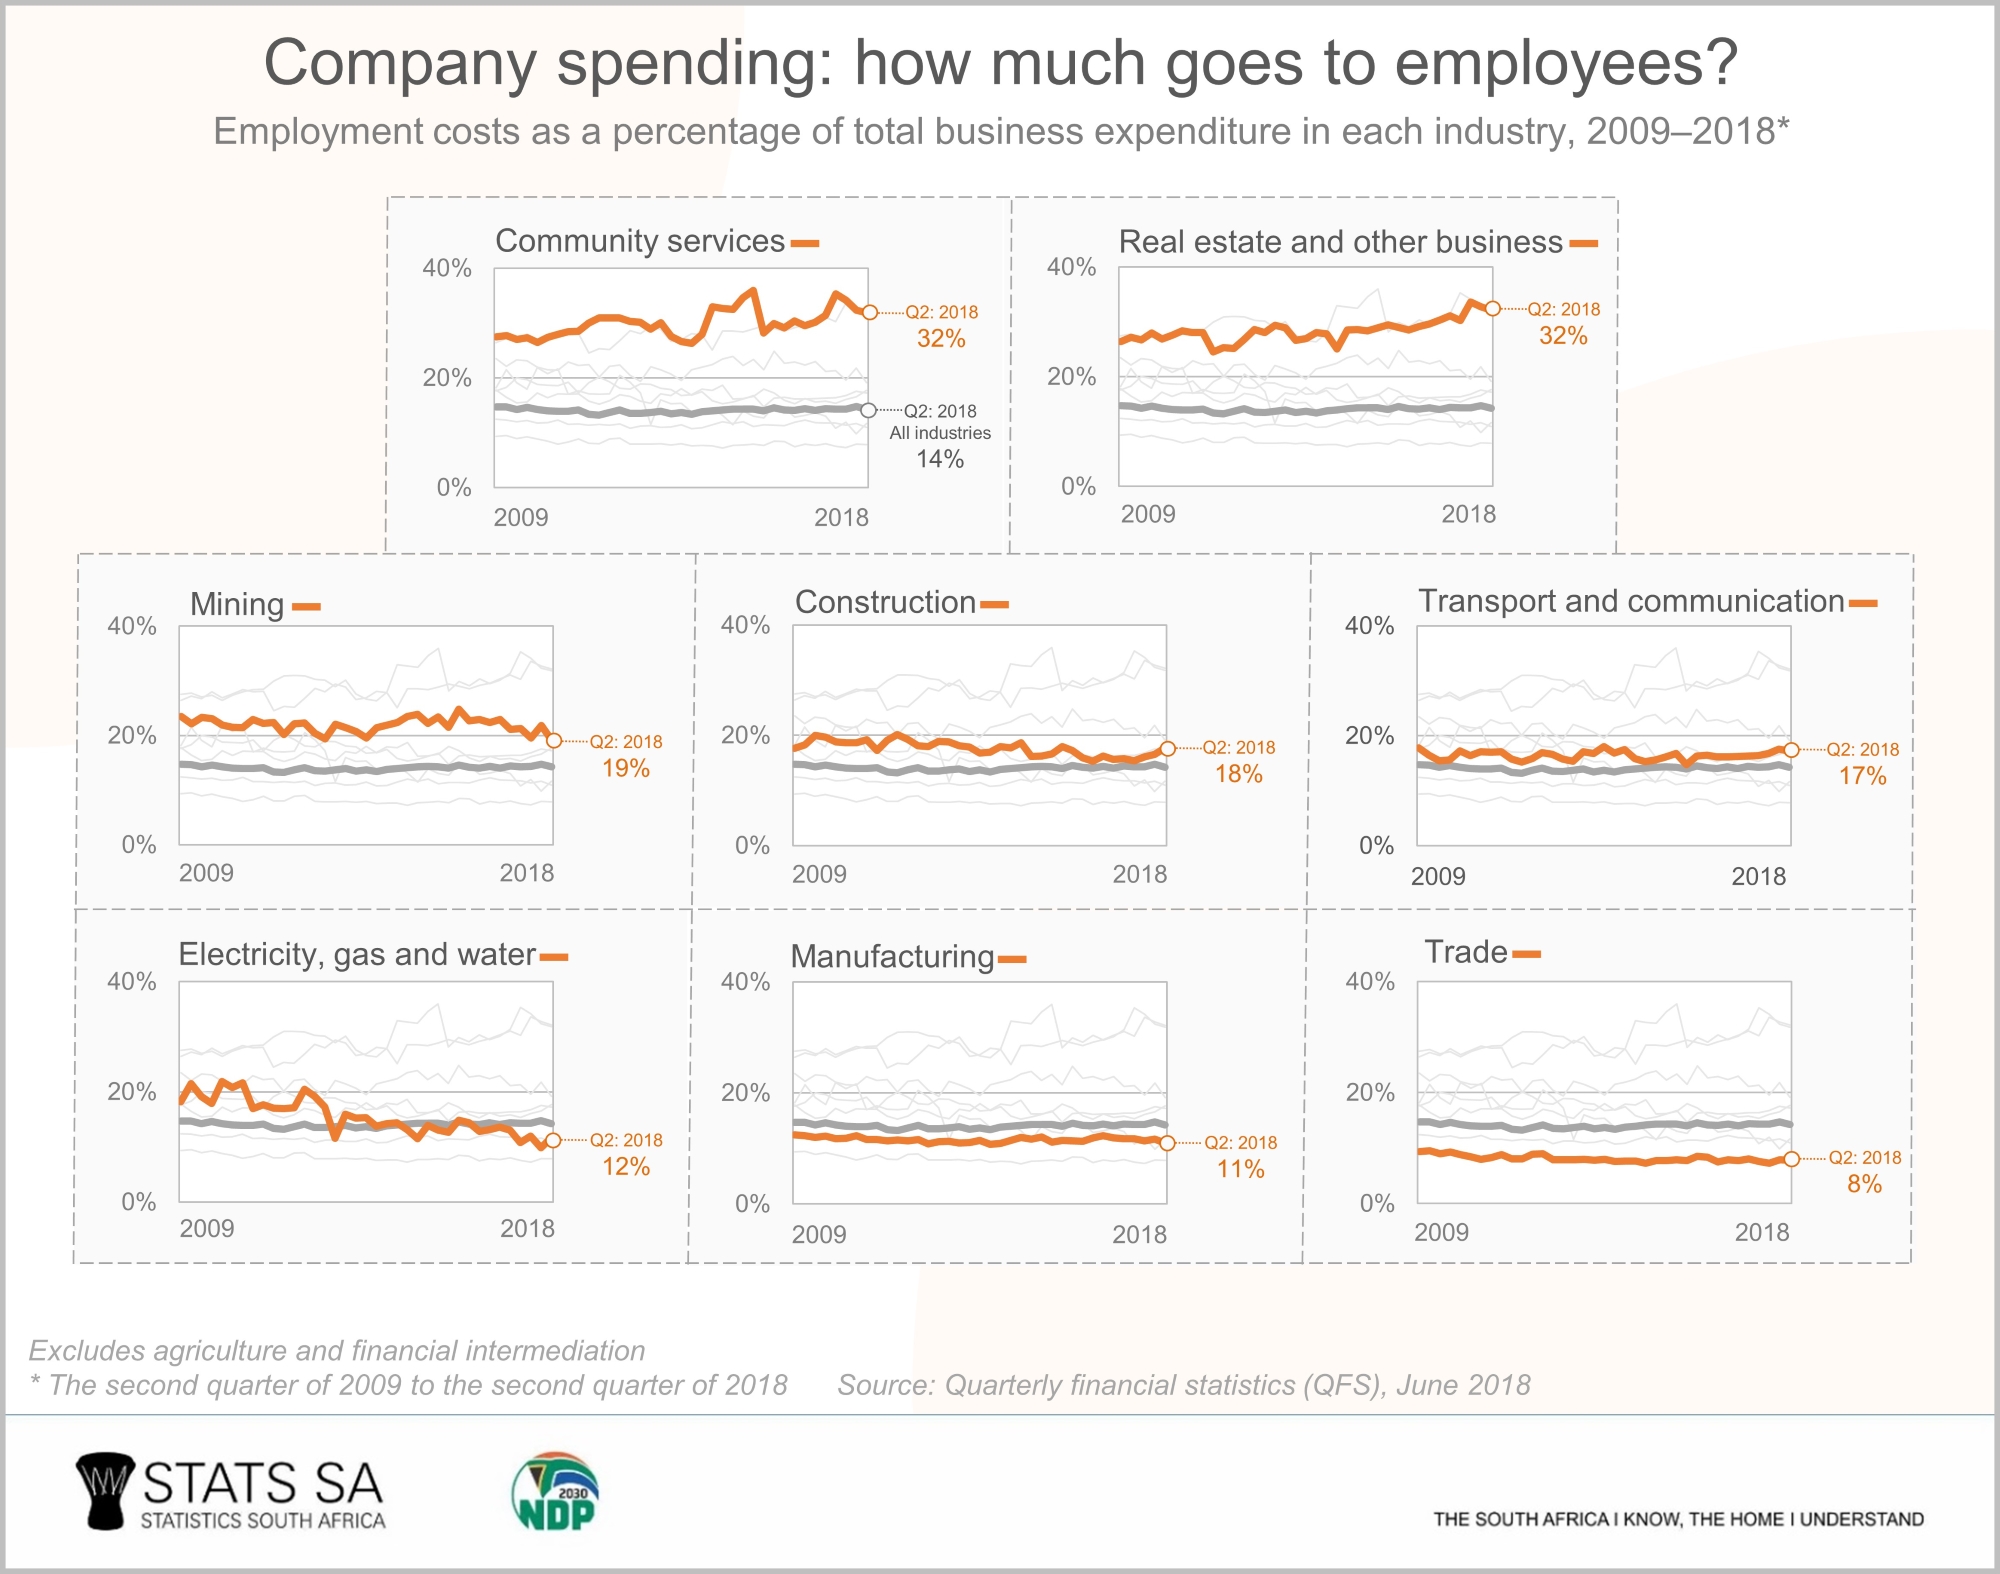
The real estate and other business services industry – which includes the country’s consultancy services, estate agents, lawyers and advertisers – also devoted 32% of total expenditure to employment costs.
Why the relatively high contribution to employment costs? Activities taking place within these two industries are often focussed on selling intellectual knowledge rather than physical goods. As a result, purchases contribute relatively less to total spending.
On the other side of the coin, notice the low contributions of employment costs in industries such as trade and manufacturing. Think of the factory that requires large amounts of raw material or the corner café that requires stock to fill its shelves. These industries spend a higher proportion on goods and materials.
You might be wondering how this all compares with government. If the formal business sector spends 14% of its budget on its employees, what is the current situation in the state? The proportion is much higher. The South African government spent 41% of total expenditure on employee-related costs in 2015/16, according to Stats SA’s latest Financial statistics of consolidated general government report.2 In 2009/10, the proportion was also 41%.
For more information, download the latest Quarterly financial statistics (QFS) report here. An annual review of performance in the formal business sector will be published in November 2018 in Stats SA’s Annual financial statistics report (for financial 2017). So watch this space!
1The formal business sector in this context refers to private businesses and public corporations covered by the Stats SA’s QFS survey, which excludes agriculture, financial intermediation, insurance, government and educational institutions.
2 Download the latest Financial statistics of consolidated general government report here. General government spent R557,1 billion on employee-related costs in 2015/16, out of a total expenditure of R1,37 trillion (excludes capital expenditure).
Similar articles are available on the Stats SA website and can be accessed here.
For a monthly overview of economic indicators and infographics, catch the latest edition of the Stats Biz newsletter here.