
#WomensMonth: Exploring the mayoral glass ceiling
Three of South Africa’s eight metropolitan municipalities were headed by female mayors in 2017. Executive Mayors Zandile Gumede (eThekwini), Olly Mlamleli (Mangaung) and Patricia de Lille (Cape Town) collectively presided over a population of 8,7 million people, comprising 15% of South Africa’s total population.1
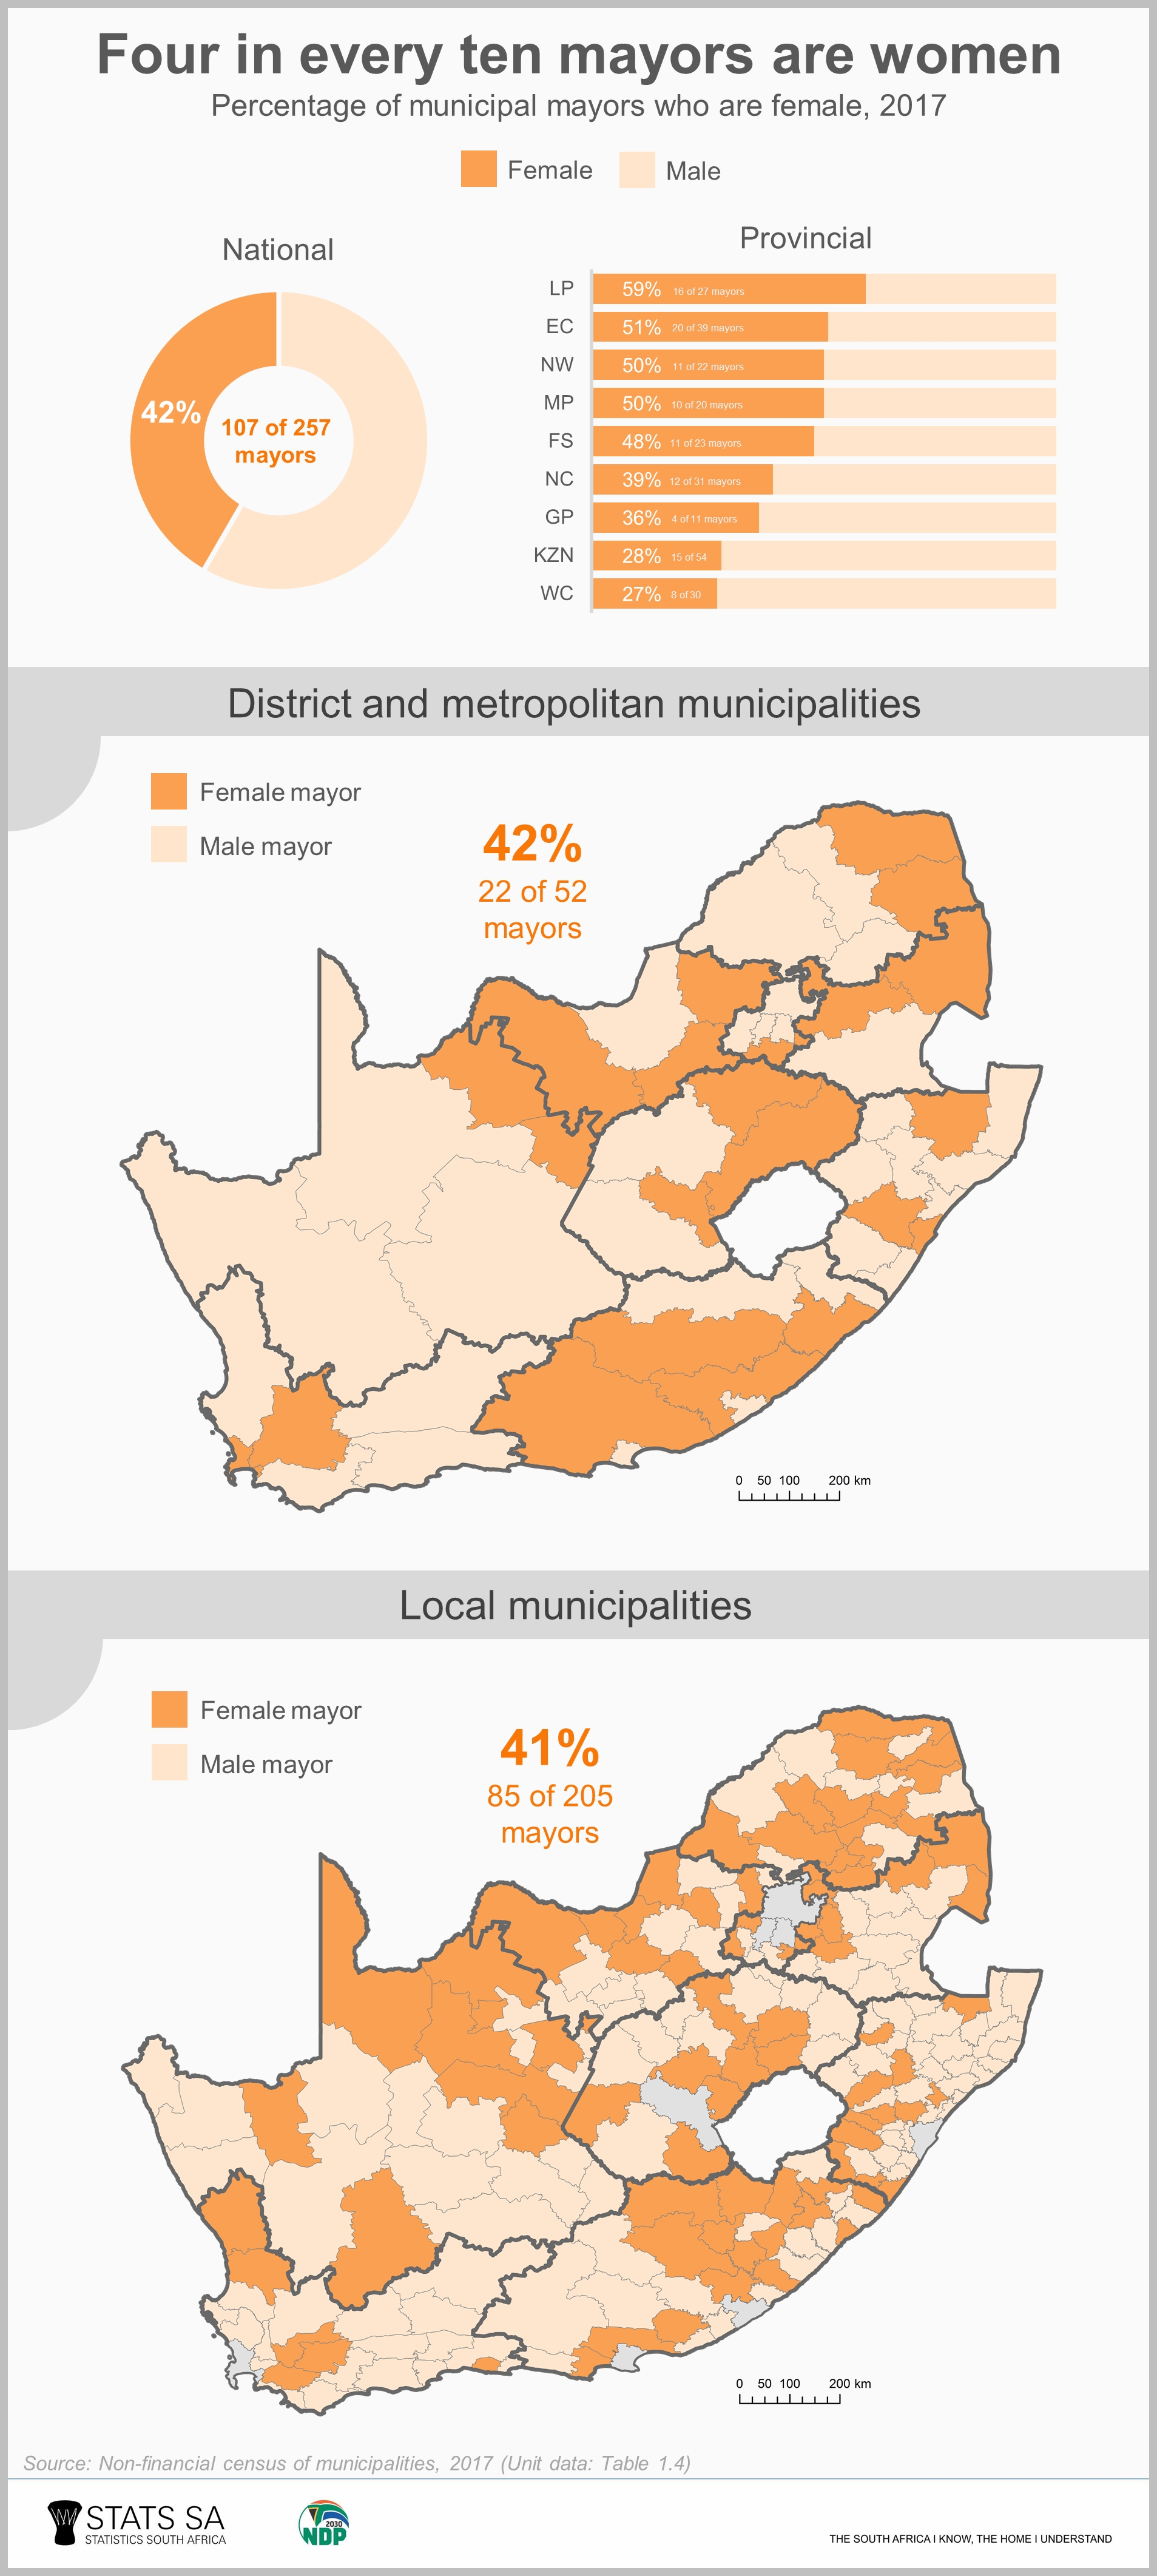
It’s not only these high-profile cities that have a woman in the highest seat of power. A scan through the data reveals that 107 of the 257 municipalities (i.e. four in every ten) had a female mayor in 2017, according to Stats SA’s latest Non-financial census of municipalities report.2
Limpopo is the shining star, with 16 of its 27 (59%) municipalities in the province having a woman at the helm. It’s reported that the province made a conscious choice after the 2016 local government elections to appoint women as mayors.3 “I want to show the world that women are capable. It is important to me that this fact should never be doubted,” – this was the sentiment expressed by Thembi Nkadimeng, the current mayor of Polokwane, shortly after she donned the chain of office in July 2014.4
KwaZulu-Natal and Western Cape still have a way to go. Only 15 (or 28%) of the 54 municipalities in KwaZulu-Natal had a female mayor in 2017. In Western Cape, women filled mayoral positions in 8 (or 27%) of the province’s 30 municipalities.
How has the pattern changed over time?
At first glance, the data seem to indicate a softening of the mayoral glass ceiling. In 2007, the earliest year for which Stats SA has data, women held 38% of mayoral seats throughout the country.5 In 2017, this figure increased to 42%.
There is a caveat to this, however. South Africa changes its municipal structure every five years during local government elections, complicating matters when data are compared over time. Boundary changes in August 2016 (reflected in the 2017 data) reduced the number of municipalities from 278 to 257.
Males happened to lose out due to the restructuring, with the number of men in mayoral seats falling from 169 to 150. The number of female mayors, however, did not change, remaining at 107 before and after the elections.
So even though there wasn’t an increase in the number of women appointed, the amalgamation of municipalities pushed the percentage of female mayors up from 38% in 2016 to 42% in 2017.
Click on the infographic to enlarge.
1 Stats SA, Mid-year population estimates, 2017 (download here).
2 Stats SA, Non-financial census of municipalities 2017, Table 1.4 (download here).
3 Capricorn Voice, 13 female mayors appointed in Limpopo, 16 August 2016 (read here).
4 Bosveld Review, 3 women at helm of Lim’s city of stars, 31 July 2014 (read here).
5 Stats SA, Non-financial census of municipalities 2008, Table 1.4 (download here).
Similar articles are available on the Stats SA website and can be accessed here.
For a monthly overview of economic indicators and infographics, catch the latest edition of the Stats Biz newsletter here.