
Despite the VAT increase, food inflation continues to fall
Annual food inflation continues to slow despite April’s rise in value added tax (VAT). In fact, some food items are actually cheaper than they were a year ago.
The items you are now paying less for are in the oil, bread, fruit and sugar categories, according to the latest Consumer Price Index (CPI) release.1 Bread and cereal prices were 3,1% cheaper in June 2018 than they were in June 2017. Fruit prices fell by 3,2% over the same period.

If we dig a little deeper into the bread and cereals data, we see the average price for a loaf of brown bread was R12,24 in June 2017, falling to R11,53 in June 2018.
Fish, meat, vegetables and dairy products have all become more expensive, however. A kilogram of hake, for example, would have set you back an average price of R41,09 in June 2017. By June 2018, the price had climbed to R47,37.
If we consider all food items in the inflation basket, overall food inflation has slowed. Food was actually 0,1% cheaper in June 2018 than it was in April 2018 when VAT was raised. Note, however, that not all food items carry VAT.
A closer look at the data suggests that much larger forces than VAT are at play: tough economic conditions and the recovery from drought.
A sluggish economy has constrained consumer spending. Household expenditure on food and non-alcoholic beverages grew by 0,7% in 2017, a bit higher than the 0,3% recorded in 2016, but lower than the 2,6% growth rate recorded in 2015.2
South Africa is also emerging from one of the worst droughts in recent history. The years 2015 and 2016 were particularly bad, with 2015 the driest year on record since 1904 when rainfall measurements began.3 Commercial maize production in particular fell by 45% in 2015/16 compared with 2013/14, according to data from the South African Grain Information Service (SAGIS).4
The slowdown in agriculture production contributed to the rise in food inflation in 2016, which reached a peak of 12% in December of that year. This means that, on average, food was 12% more expensive in December 2016 than it was in December 2015.

Agriculture began to find its feet again in 2017, contributing to a slowdown in food inflation. The grain industry bounced back relatively quickly, recording its most successful commercial maize season ever in 2016/17.4
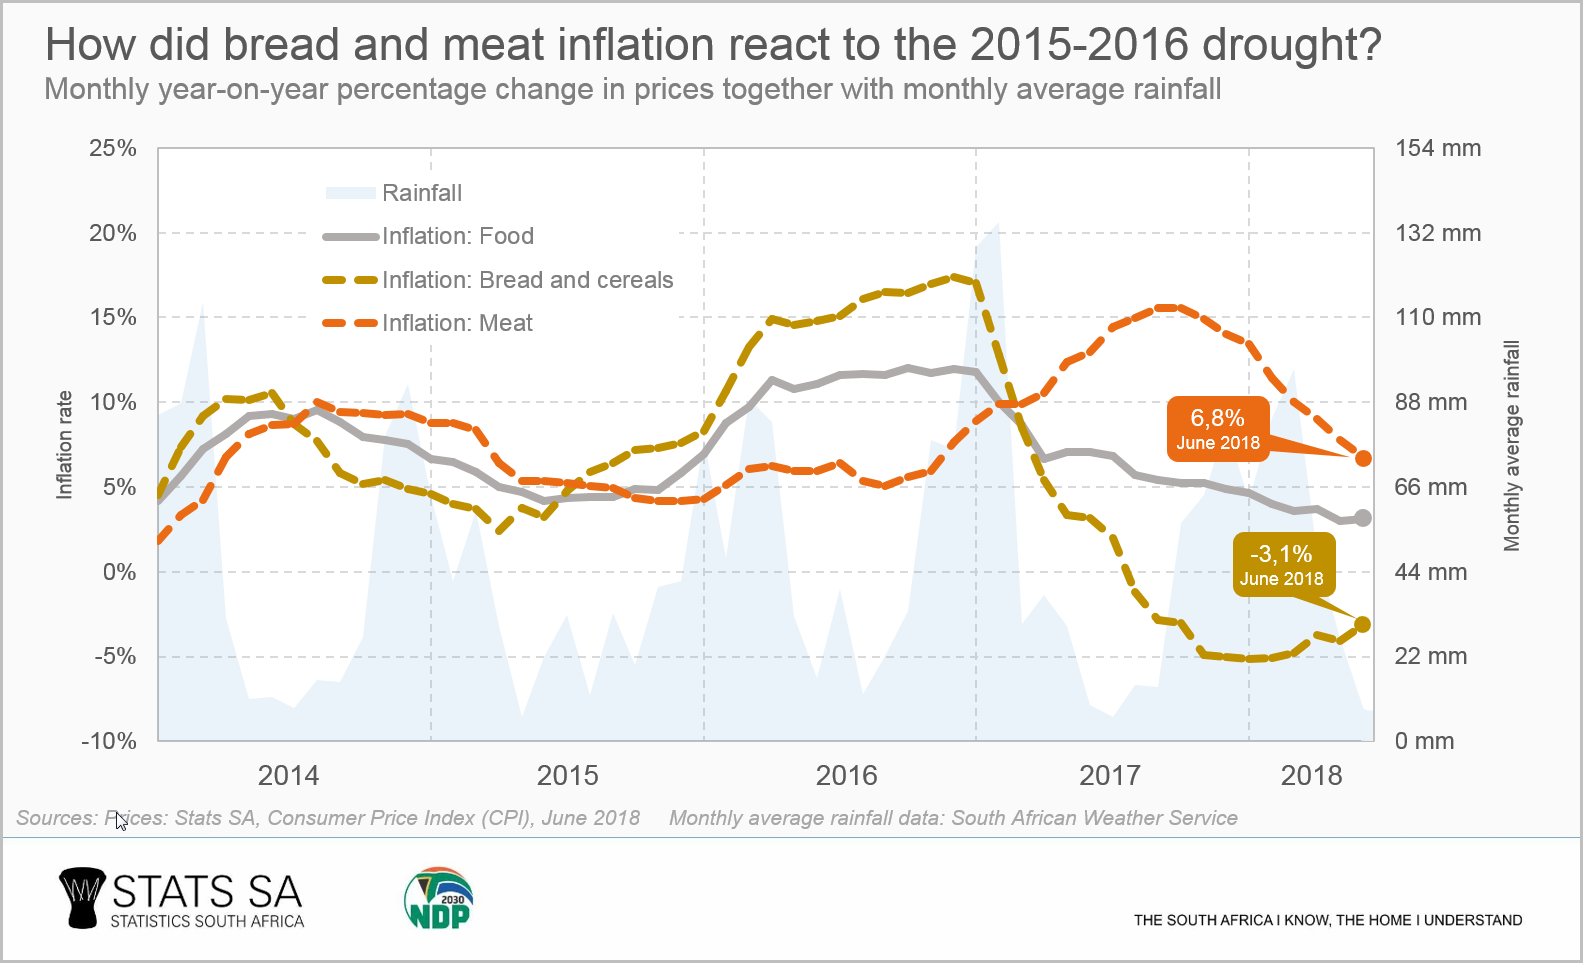
The bread and cereal inflation rate fell in line with the recovery, diving into negative territory in August 2017. When the inflation rate falls below 0%, it is referred to as deflation. This signifies that the price of a good or service is no longer rising but is in fact falling over time.
Meat prices, on the other hand, behaved quite differently. As bread and cereal prices were rising at around 15% year-on-year in 2016, meat inflation was somewhat subdued, hovering around the 5% mark. Meat inflation started to rise near the end of 2016, overtaking bread and cereals in March 2017.
The reason for this pattern? It takes a lot longer for meat production to recover. During a severe drought, cattle farmers are unable to feed their stock, and they are eventually forced to cull their herds. For a brief period of time, the increased supply of meat causes prices to stabilise or even fall.
It takes time to rebuild herds once the rains return, causing a lack of meat once the initial surge in supply ebbs away. Meat inflation then starts to climb as a result.
In short, volatile weather causes volatile agricultural production and prices, which makes life difficult for farmers and consumers alike, not to mention economic policy makers as well as the manufacturers and retailers who get our food from farm to table. Whether the weather becomes more or less erratic going forward, only time will tell.
1 Download the latest Consumer Price Index (CPI) release here.
2 Gross domestic product (GDP), Q1: 2018, GDP P0441- 2018Q1 Excel file, Tab 13 (download the file here).
3 South African Weather Service, South Africa – Annual Total Rainfall, 13 January 2016 (read here).
4 South African Grain Information Service (SAGIS) data are available here.
Rainfall data was kindly provided by the South African Weather Service.
Similar articles are available on the Stats SA website and can be accessed here.
For a monthly overview of economic indicators and infographics, catch the latest edition of the Stats Biz newsletter here.