
Electricity: Coal use inches lower as solar, wind and diesel rise
If you’re curious, take a deeper look at Stats SA’s latest large sample survey of the electricity, gas and water supply industry. The report provides some insight into the current state of electricity generation in South Africa. In particular, highlighting the subtle changes that have occurred in the country’s energy supply.
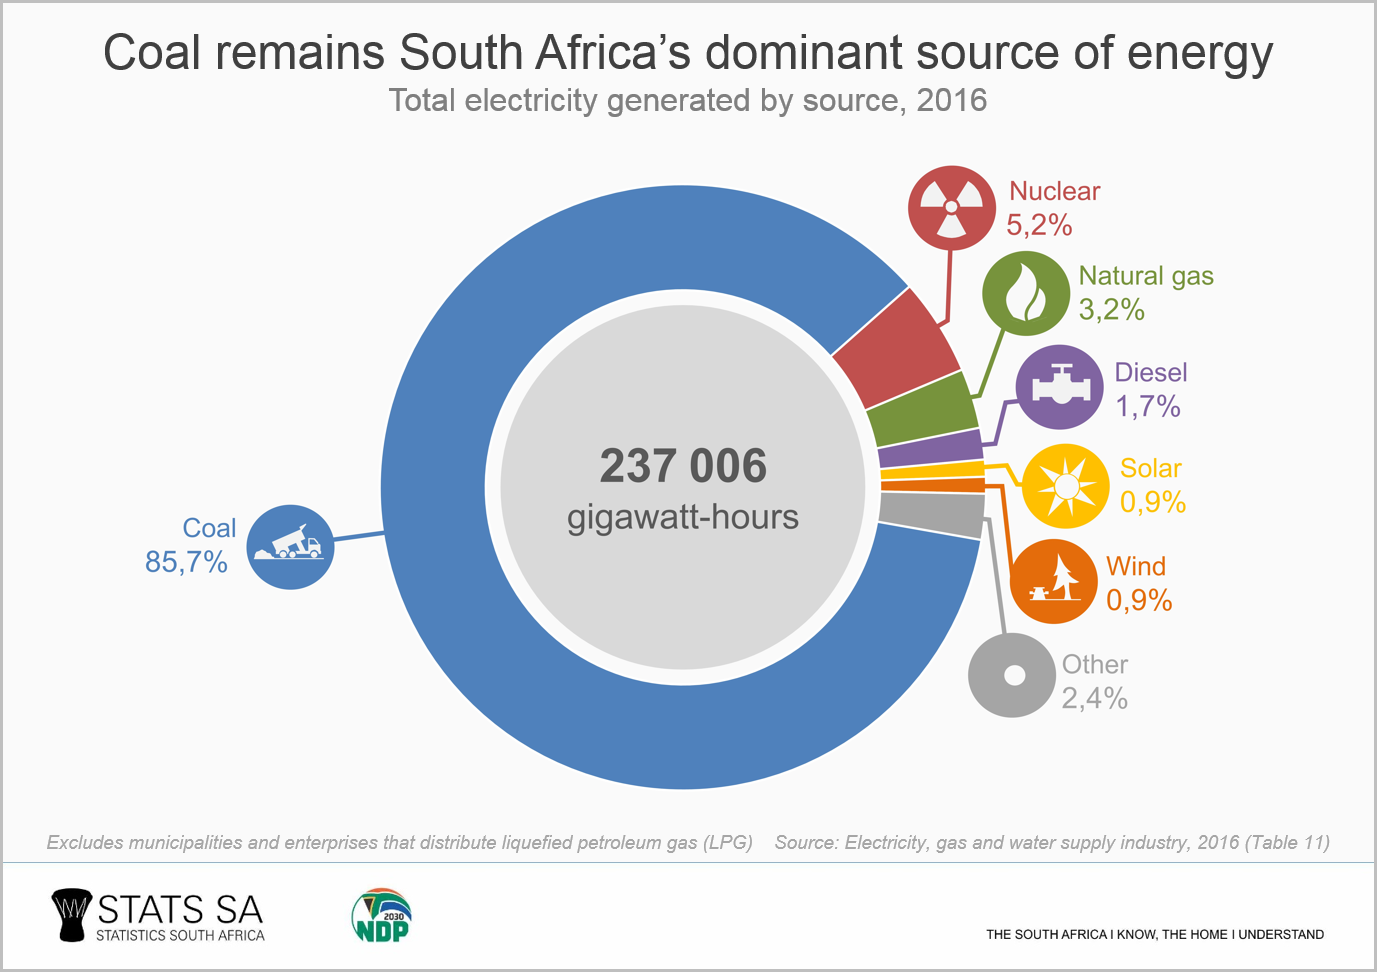
South Africa is still largely addicted to coal-based electricity. The recently released Electricity, gas and water supply industry report for 20161 shows that this fossil fuel generated 85,7% of the country’s power in 2016, followed by nuclear power (5,2%) and natural gas (3,2%).
For those hoping for a shift towards cleaner energy, the overwhelming dominance of coal might seem impossible to break. Not only is coal a relatively cheap source of energy, but South Africa has abundant reserves.2 The mineral also contributes to economic growth, having surpassed gold in 2008 as the larger contributor to gross domestic product (GDP). Coal mining was responsible for 1,8% of total value added in 2016, higher than gold (1,3%), but on par with platinum group metals (1,8%).3
There is a sliver of hope in the data, however. The Electricity, gas and water supply industry report shows a slight softening of coal’s dominance and a rise in the influence of solar and wind power. Coal generated 88,3% (or 215 691 GWh) of South Africa’s electricity supply in 2013, falling to the previously mentioned 85,7% (or 203 054 GWh) in 2016.
Solar energy didn’t feature at all in the 2013 figures, but in 2016 it contributed 2 151 GWh to the national grid. Wind power was responsible for producing 18 GWh of electricity in 2013, jumping to 2 126 GWh in 2016. This corresponds with the construction of a number of wind farms over that period, most notably the Jefferys Bay and Cookhouse sites in Eastern Cape.
But what about diesel?
A closer look at the data will uncover another important fact that might dampen any excitement over clean energy: the rise in the use of diesel. The electricity, gas and water supply industry purchased just over 1 336 megalitres of diesel in 2016, primarily used to generate electricity. This is 124% higher than the 596 megalitres of diesel purchased in 2013. This brings to mind Eskom’s reliance on open cycle gas turbines in recent years as a way to sustain electricity supply during periods of high demand.
To put this in perspective, 596 megalitres of diesel would fill up about 238 Olympic-size swimming pools, while 534 swimming pools would be required to store 1 336 megalitres!
This might raise an interesting thought: was the fall in the use of coal a temporary decline due to increased diesel use and the prevalence of other energy sources, or could this be the beginning of a longer-term trend as clean energy starts to make an impact? With the construction of additional wind farms, and government’s recent signing of renewable energy agreements with independent power producers (IPPs),4 the future of clean energy looks hopeful. But only time will tell what impact this will have on South Africa’s energy mix.
1 Download the 2016 Electricity, gas and water supply industry report here. The figures used in this article are from Table 11 and Table 13.
2 South Africa has an estimated 256 years of available coal reserves left. Source: Stats SA, Environmental Economic Accounts Compendium, Table 3.2 (download here).
3 Stats SA, GDP P0441 Annual, quarterly and regional Fourth quarter 2017 (Excel file), Table 10 (download here).
4 Stats SA, Energy and the poor: a municipal breakdown (read here).
Similar articles are available on the Stats SA website and can be accessed here.
For a monthly overview of economic indicators and infographics, catch the latest edition of the Stats Biz newsletter here.