
Four facts about municipal debt
Eskom announced earlier this year that it would roll out power cuts to several defaulting municipalities.1 The inability of particular municipalities to honour debt payments has been a thorn in the flesh of local government administration. The following are a few key facts about municipal debt, from Statistics South Africa’s latest Financial census of municipalities (FCM) report.
Fact 1: Free State municipalities experienced the biggest rise in debt
Total South African municipal debt increased by 6,8% in 2016/17 compared with 2015/16. Municipal debt, which includes monies owed to municipal lenders, suppliers and other creditors, amounted to R225,8 billion in 2016/17, an increase from the R211,4 billion recorded in the previous financial year.
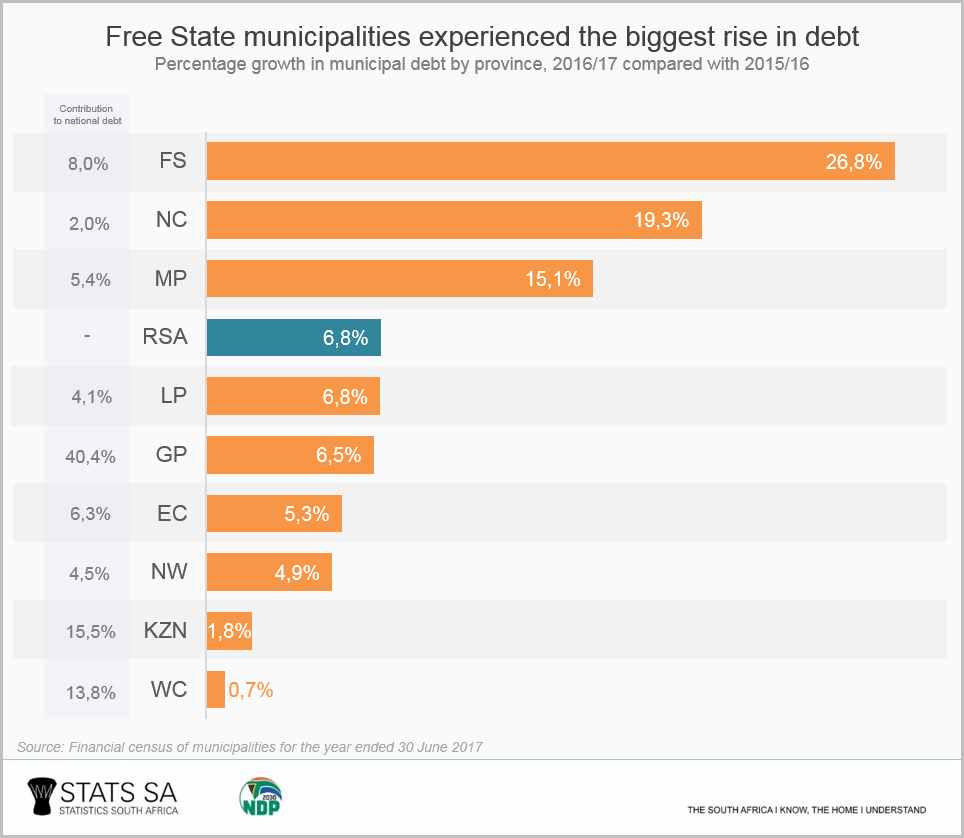
Municipalities in Free State saw their debt rise by 26,8%, followed by Northern Cape (up 19,3%) and Mpumalanga (up 15,1%). Western Cape and KwaZulu-Natal experienced the lowest increases.
Fact 2: Bank loans contribute 5,8% to total debt

Debt owed to creditors, which include registered suppliers and service providers such as Eskom and the water boards, contributed 43,0% to total municipal debt in 2016/17. The debt for trade creditors is mainly for goods and services purchased on credit. Also included in that amount are credit balances in consumer debtors, amounts received in advance for services still to be rendered, consumer deposits, retentions and accrued interest.
Provisions (contributing 13,1%) largely includes the provision for bad debts, unspent conditional grants (deferred income) and leave pay-outs. Loans from the Development Bank of Southern Africa (DBSA), which are mainly used for infrastructure acquisitions, contributed 10,9%. Retirement benefits contributed 9,8%. This includes pension benefit obligations that are due to municipal employees when they go on retirement.
Bonds contributed 8,1% of the debt pie. Of South Africa’s 257 municipalities, only four metropolitan councils (i.e. Johannesburg, Cape Town, Tshwane and Ekurhuleni) have issued bonds.
Bank loans contributed 5,8%. The four largest commercial banks (i.e. First National Bank, ABSA, Standard Bank and Nedbank) were the major players. The Infrastructure Finance Corporation Limited (INCA) was previously also a notable lender, although it’s no longer granting new loans to municipalities.2
Other payables contributed 18,3%, and this includes Value Added Tax (VAT) due to the South African Revenue Services (SARS), bank overdrafts facilities arranged by banks for municipalities and finance lease obligations.
Fact 3: Four metropolitan municipalities are responsible for almost half of total debt
Together, South Africa’s eight metropolitan municipalities contributed almost two-thirds to municipal debt, amounting to R142,2 billion in 2016/17, followed by local municipalities at 32% (or R72,8 billion). District municipalities accounted for the remaining 5% (or R10,8 billion). This is not surprising as most district municipalities provide an administrative role and are not involved in procuring services such as electricity, water, refuse removal and sanitation.

The metropolitan municipalities of Johannesburg, Tshwane, eThekwini and Cape Town contributed 49% to local government liabilities in 2016/17. Together, these four cities have a population of almost 17 million people, making up 30% of South Africa’s total population.3
Fact 4: Renosterberg local municipality has the highest debt-to-income ratio
The debt-to-income ratio is the amount of debt divided by annual income. A high debt-to-income ratio can raise the risk profile of a municipality, making it more difficult for a municipality to obtain funding from creditors. It must be noted that the total income for municipalities includes capital transfers or grants that make it slightly higher than operational income (i.e. income received in the form of property rates and service charges). Should these be excluded, the ratios would be slightly higher across the board.

Municipalities with low debt-to-income ratios (blue and green on the map) are located in predominantly rural provinces such as Eastern Cape, KwaZulu-Natal and Limpopo. Municipalities with high debt levels are scattered across six provinces. Seven municipalities with a debt-to-income ratio higher than 1 are located in Free State. The municipality with the highest debt-to-income ratio is Renosterberg in Northern Cape (6,25).
When interpreting the debt-to-income ratio, one should keep in mind that there are many factors at play, such as the powers and functions that differ across different types of municipalities (as mentioned above), accessibility to finances, cash flows, and the state of the regulatory environment.
Download the latest Financial census of municipalities report here. The data within the report are verified against the annual financial statements received from municipalities as well as data from National Treasury, South African Reserve Bank, Development Bank of South Africa (DBSA), and other relevant publications within or outside Stats SA. Please note that all the figures in this article are expressed in current prices.
1 Daily Maverick, Eskom Debt: Power cuts scheduled for municipalities that don’t pay (read here).
2 National Treasury, Municipal borrowing bulletin, Issue 1: June 2016 (download here).
3 Stats SA, Mid-year population estimates, 2017 (download here).