
Five facts about the retail trade industry
The South African trade industry is made up of five divisions: wholesale, motor, accommodation, food and beverages (i.e. restaurants and catering), and retail. Stats SA takes a look at five facts that you might not have known about the retail trade industry.
Fact 1: South Africans spent R31 900 per second in retail stores in 2017
Thank you kindly for your participation in the economy. You contributed a small portion to the R1 trillion in sales (current prices) generated by the retail trade industry in 2017, every time you stepped into a store to buy groceries, clothes or electronic equipment. This translates to about R31 900 spent per second across the industry during the course of that year.
And consumers weren’t shy to spend a little more in 2017 than they did in 2016. Spending on retail was up by 2,9% in 2017 compared with 2016 in volume terms (constant prices), higher than the 1,7% annual growth recorded in 2016, but lower than the 3,3% in 20151.
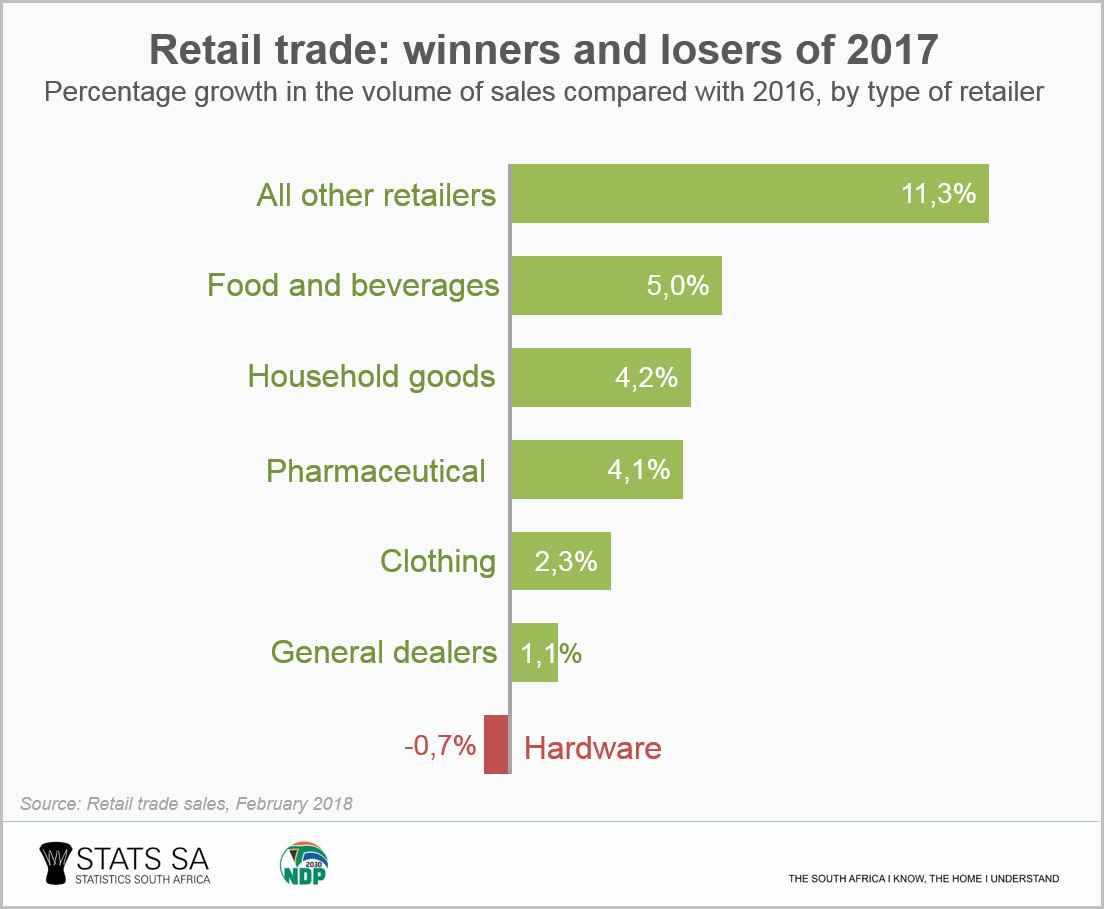
Stores specialising in food and beverages had particular reason to smile. They saw their sales rise by 5,0% in 2017, the second largest annual growth rate recorded across various store types, after the miscellaneous ‘all other retailers’ category. Hardware stores, however, saw a decline in sales (click on the chart to enlarge).
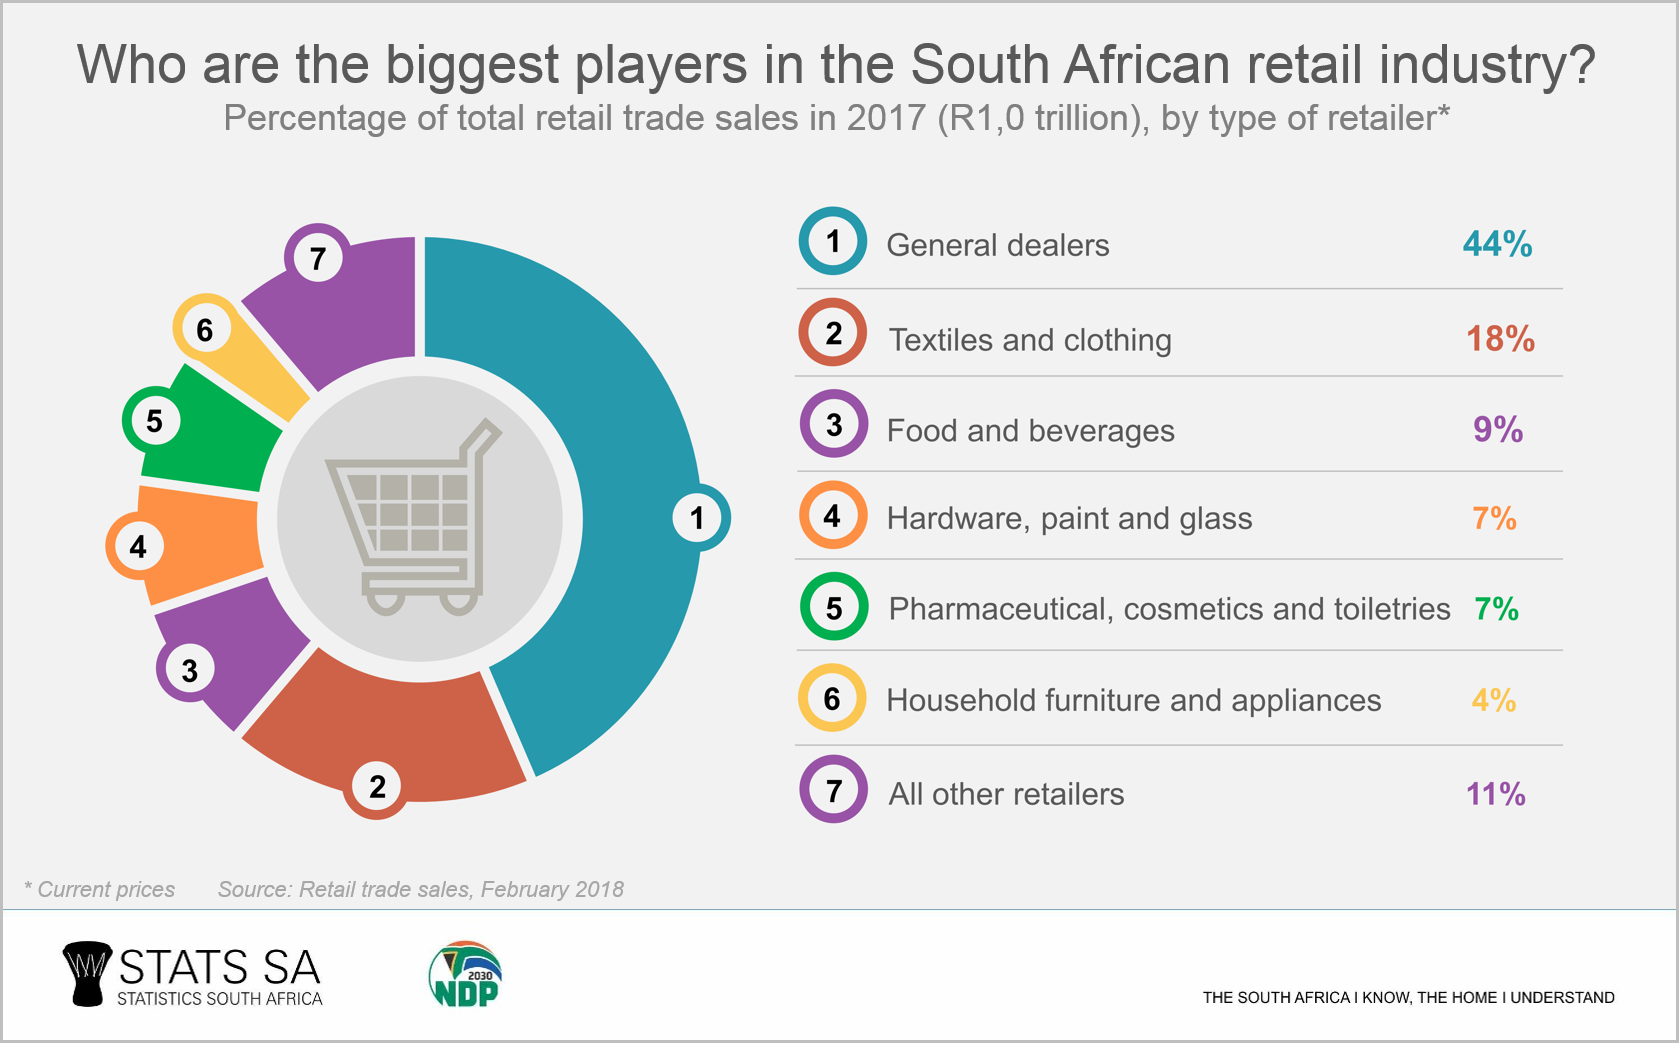
Fact 2: General dealers are responsible for 44% of sales
Despite general dealers experiencing lacklustre growth of only 1,1% in 2017, they dominated the industry in terms of sales value. For every R100 that consumers spent at retail stores in 2017, R44 was spent at general dealers, which includes supermarkets.
The second largest contributor was stores specialising in clothing and textiles, contributing R18 for every R100 of total sales.
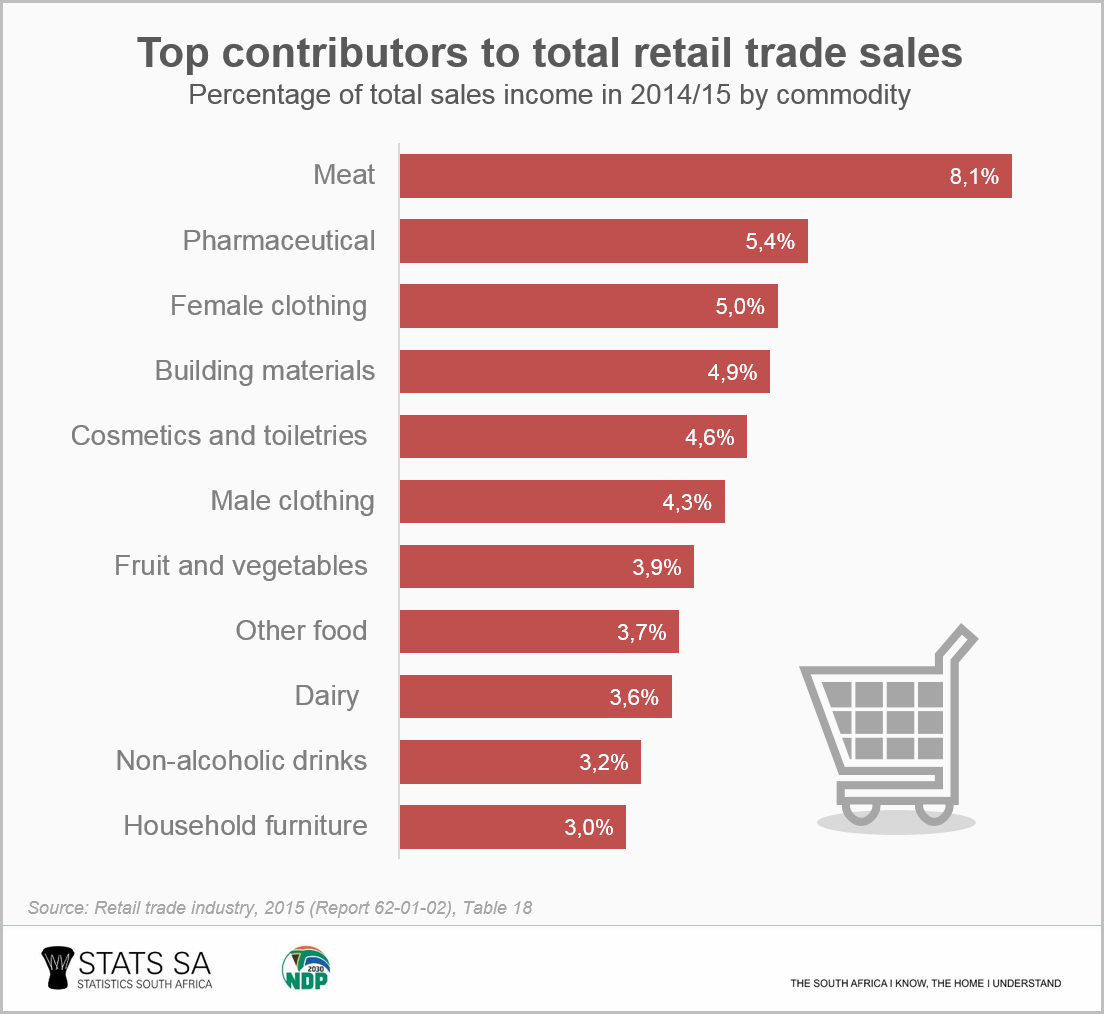
Fact 3: Meat accounts for 8,1% of total sales income
South Africans love their meat. A detailed list of products shows meat as the most popular commodity in the retail trade industry, contributing 8,1% to total sales income in 2014/15. Pharmaceutical goods and female clothing were the second and third most popular products, according to Stats SA’s Retail trade industry, 2015 report.2 The top eleven products that contributed half of total sales income are shown below.
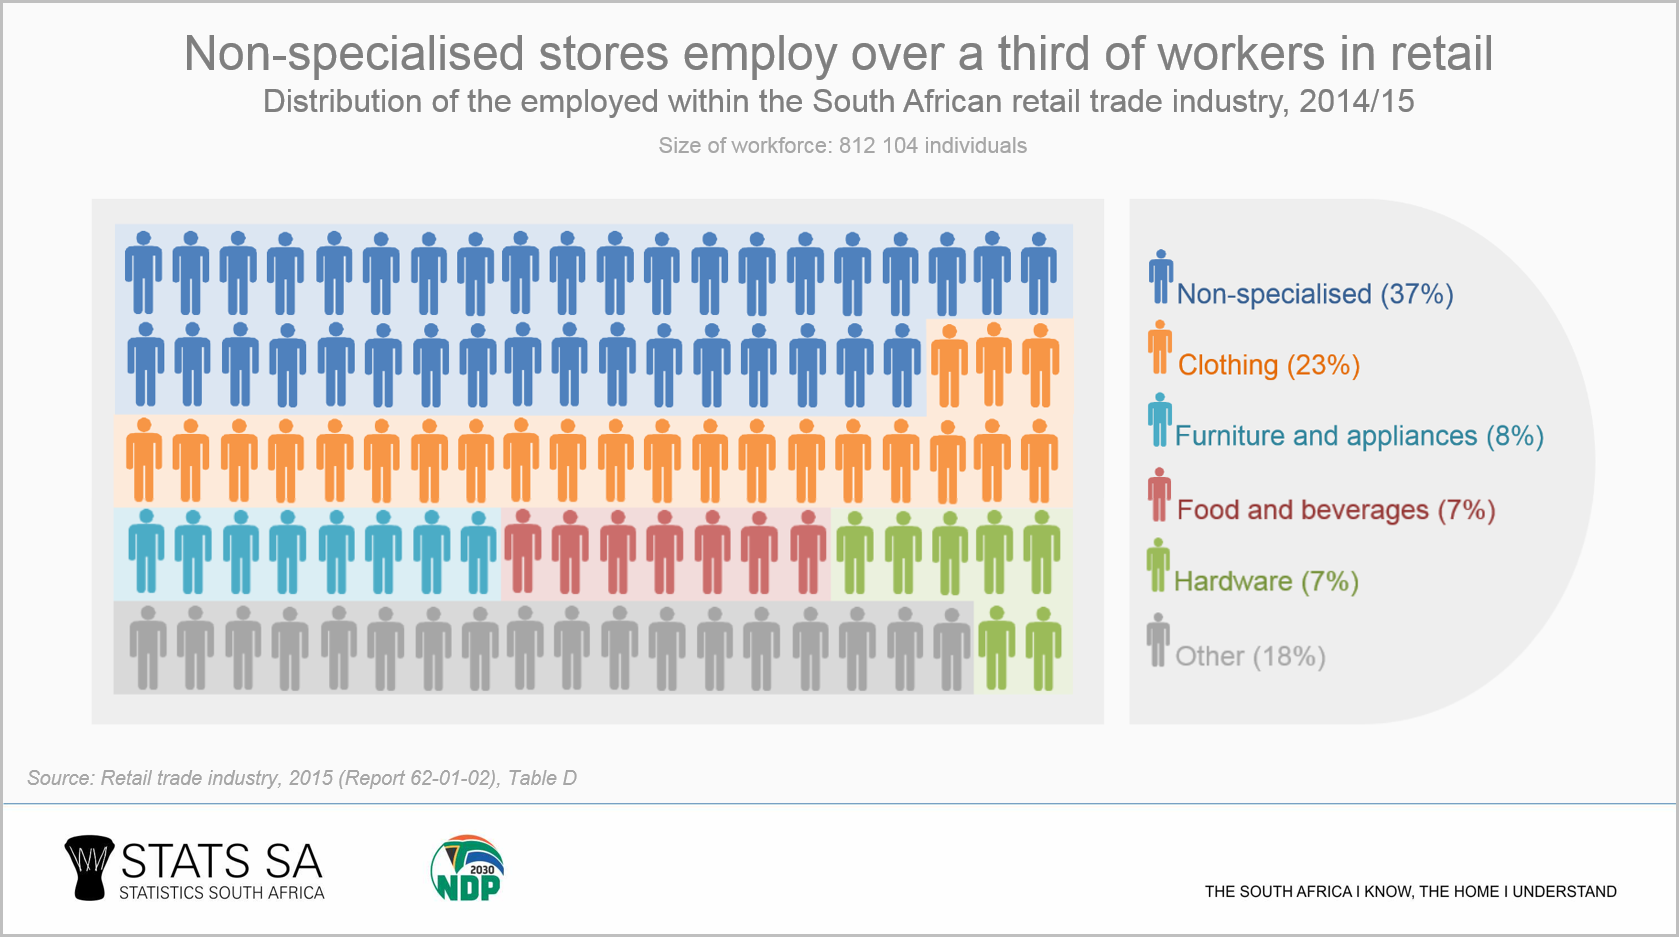
Fact 4: Non-specialised stores are the largest employer
In 2014/15, over one-third of the 812 104 individuals working in retail were employed in non-specialised stores. Clothing stores were second, employing 23% of the retail workforce
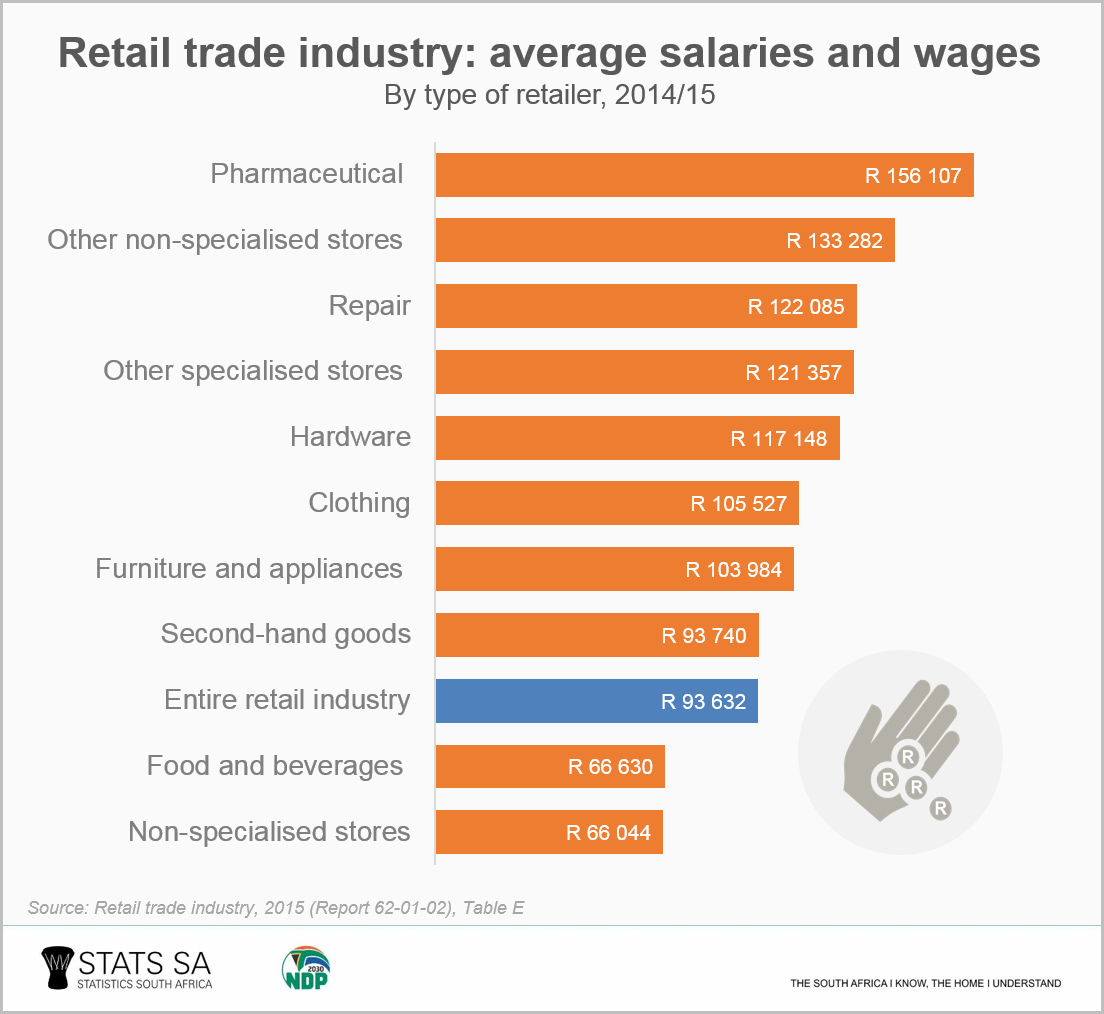
Fact 5: Non-specialised stores pay the lowest salaries
Non-specialised stores have the highest number of employees but the lowest salaries. The average annual salary for a person working in a non-specialised store was R66 044 in 2014/15, lower than the average of R93 632 for the entire retail trade industry. Compare this with the average salary for employers in retail outlets specialising in pharmaceutical goods.
1 The most recent monthly Retail trade sales publication can be accessed here.
2 Download the Retail trade industry, 2015 report here. The media presentation for the report – containing employment, financial and salary information – is available here. The reporting period was the financial year ended on any date between 1 July 2014 and 30 June 2015.
Similar articles are available on the Stats SA website and can be accessed here.
For a monthly overview of economic indicators and infographics, catch the latest edition of the Stats Biz newsletter here.