Mining: winners and losers of 2017
The 2017 Mining Charter published by government in June has seen its fair share of debate, opening intense discussions on the industry’s future. Outside of this policy debate, Stats SA recently published figures showing how the industry performed in 2016 and 2017.
2016 wasn’t a good year for South African mining. The industry as a whole saw a decline of 4,0% that year, the largest annual fall in production since the global recession of 2009. Only one mineral managed to keep its head above water: diamond production recorded positive growth of just under 1%. All other minerals found themselves in negative territory in 2016, with copper the worst performer, recording a 16% fall in production.
Manganese and diamonds shine in 2017
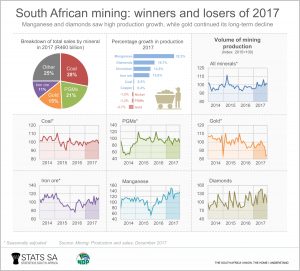
The industry fared much better in 2017 on the back of higher mineral prices and increased global demand. Production was up by 4,0% last year1, bringing some relief to the embattled industry.
Manganese ore was the star of 2017, with production of the metal rising by 32%. Diamond mining, the sole performer of 2016, had an even better 2017, placing it as the second most successful mineral after manganese (up 17%).
Rising demand in China for steel was the main driver behind the rise in manganese production. Chromium and iron ore, two other minerals used in the production of steel (in the case of chromium, stainless steel), were the third and fourth best performing minerals in 2017.
Gold continues to fall
Stats SA has previously highlighted the extent to which gold mining has lost ground over the last three decades.2 The precious metal continued its production decline, slipping by 3,7% in 2017. The annual production index for gold is now 46% lower than it was in 2007.
In fact, South African gold production has experienced only four years of positive growth since 1990: these were in 1992, 1993, 2002 and 2013. All other years saw a decline, with the largest annual fall occurring in 2008 (-16%).
Employment has been the obvious victim. Just over two in every three gold mining jobs in 1995 no longer exist. Gold mining employed about 380 000 people in 1995, according to Stats SA’s Environmental Economic Accounts Compendium report3, falling to about 119 000 people in 2014.
Despite the fall in production, gold still finds itself in the top three in terms of the value of sales. South African mineral sales were dominated by coal (28%) and platinum group metals (21%) in 2017, followed by gold (15%). However, with estimates that South Africa has 39 years of accessible gold reserves remaining4, it remains to be seen how long gold will hold onto this position.
Why is mining still important?
Mining as a whole is still an important player in the South African economy. The industry contributes R8 for every R100 produced by the national economy5 and employs one in every 40 working individuals (or 2,5% of the entire workforce).6
These figures might not sound that impressive at a glance, until you consider that mining is more important to some regions than others. Mining is the largest industry in four of South Africa’s nine provinces: North West, Limpopo, Mpumalanga and Northern Cape.7 In particular, mining contributed R33 for every R100 produced by North West’s economy in 20158, and the industry employed one in every 6 working individuals (or 16% of the provincial workforce).9
Updated provincial GDP estimates will be published on 6 March 2018, providing a fresh picture of mining’s influence in each province, as well as for the country as a whole.10
Whatever the outcome of renewed deliberations around the future of South African mining, efforts to ensure a sustained growth path are vital to the livelihoods of communities that depend on this industry.
1 Download the December 2017 release of Mining: Production and sales here.
2 The decreasing importance of gold mining in South Africa (read here).
3 Environment economic accounts compendium, 2017, Table 4.9 (download here). More information on jobs in the mining industry can be found here.
4 Environment economic accounts compendium, 2017, Table 3.6 (download here).
5 GDP Q3 2017 media presentation, Slide 12 (download here).
6 Quarterly Labour Force Survey, Quarter 4, 2017, Table B (download here)
7 Your job, your economy, your province (read here)
8 GDP Q4 2016 media presentation, Slide 48 (download here).
9 Labour Market Dynamics, 2015 (figures extracted from SuperWEB).
10 GDP Q4 2017 figures will be published here.


