

IMPROVING LIVES THROUGH DATA ECOSYSTEMS
South Africans are living longer
The mid-year population estimates are used to account for population change during the period between Censuses and usually takes place at the mid-year point. This is usually done annually, rather than over a period of time as is the case with census, which is conducted after every 5 or 10 years. This year’s mid-year population estimates show that South Africans have been having fewer babies (fertility rate) and living longer (life expectancy) over the past 10 years.
Gauteng and the Western Cape had the highest in-migration, meaning more people are moving into these provinces than leaving them. North West and Mpumalanga are also showing more people moving into than out of the province. Eastern Cape and Limpopo, however, have more people moving out of the provinces than moving in. The estimates also take into account dynamics around the births and deaths of people in South Africa by provinces.
Here is some key information from the 2013 mid-year estimates:
 Population

- There are 52,98 million people in South Africa.
- 79,8% are black African.
- 9% are coloured.
- 8,7% are white.
- 2,5% are Indian.
- The population grows at a rate of 1,34% per year.
- The number of births are at 1 084 397.
- Deaths stand at 559 631, consistent with the data we see from our administrative data.
- 29,2% of the population are under the age of 15 while 5,2% are 65 and over.
HIV/AIDS
- 10% of the population is HIV positive.
- The number of people living with HIV is 5,26 million.
- 17,4% of females have HIV.
- 15,9% of adults are HIV positive.
- HIV in youths (15–24 years) has dropped to 8,5% since 2011.
- The percentage of adults showing new HIV infections has dropped to 0,85%.
- The number of AIDS-related deaths stand at 178 373, which is 31,9% of all deaths. Incidentally, for 2010 the HIV/AIDS-related deaths are consistent with those reported via death certificates in the Mortality and causes of death reports.
Migration
- As far as international migration is concerned, for the period 2011–2015 a net migration of just under a million is assumed.
- Net migration means the difference between people coming into and leaving the country.
- This is in line with what the International Organisation of Migration and the United Nations Population Division expects.
Fertility
- The number of births per 1 000 people per year continues to drop and currently stands at 20,5.
- The average number of children born to a woman in her lifetime, known as the total fertility rate, has dropped to 2,34 from 2,71 children per woman in 2002.
Mortality
- The number of deaths per 1 000 people per year dropped to 10,6.
Life expectancy
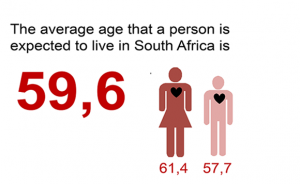
- Life expectancy at birth for males is 57,7years (up from 49,5 years in 2003).
- Life expectancy at birth for females is 61,4 years (up from 54,4 years in 2003).
- Overall life expectancy in South Africa is 59,6 years (up from 52,1 years in 2003).
Provinces
The most densely populated provinces are:
- 24% of people live in Gauteng.
- 19,7% live in KwaZulu-Natal.
- 12,5% live in the Eastern Cape.
- The Northern Cape has the highest percentage (30%) of those under the age of 15. This is followed by KwaZulu-Natal (22%) and Gauteng (19,5%).
How do estimates differ from census?
- The main difference is that the estimates monitor change across a period of time, say 10 years. A census, however, gives a snapshot of a country at a particular time. Thus we can say that the Census 2011 results show us the state of the country at 10 October 2011.
- The releases serve different purposes; as census information is more detailed than the mid-year estimates because the questions people answered in the census were incredibly detailed. One advantage of census information is that it can provide more information about South Africa’s social and economic conditions than any other survey.
- The mid-year estimates should be used for planning and policy-making as these are part of a time series of 10 years.
- Neither source is more right than the other; they serve different purposes.
- When using the mid-year estimates, note that they represent a set of assumptions.
- As Stats SA conducts its regular surveys the information is used to update the assumptions made when calculating the estimates. For the purpose of comparison, retrospective estimates using the latest set of assumptions are provided by Stats SA at national and provincial level.