
Infographic: Government’s spending priorities
Stats SA recently released a complete overview of total government spending for 2015/16, providing insight into where your tax contributions have gone. Did you know that more money was spent on the police than on primary education, and more on defence than on environmental protection? Have a look at this infographic for more.
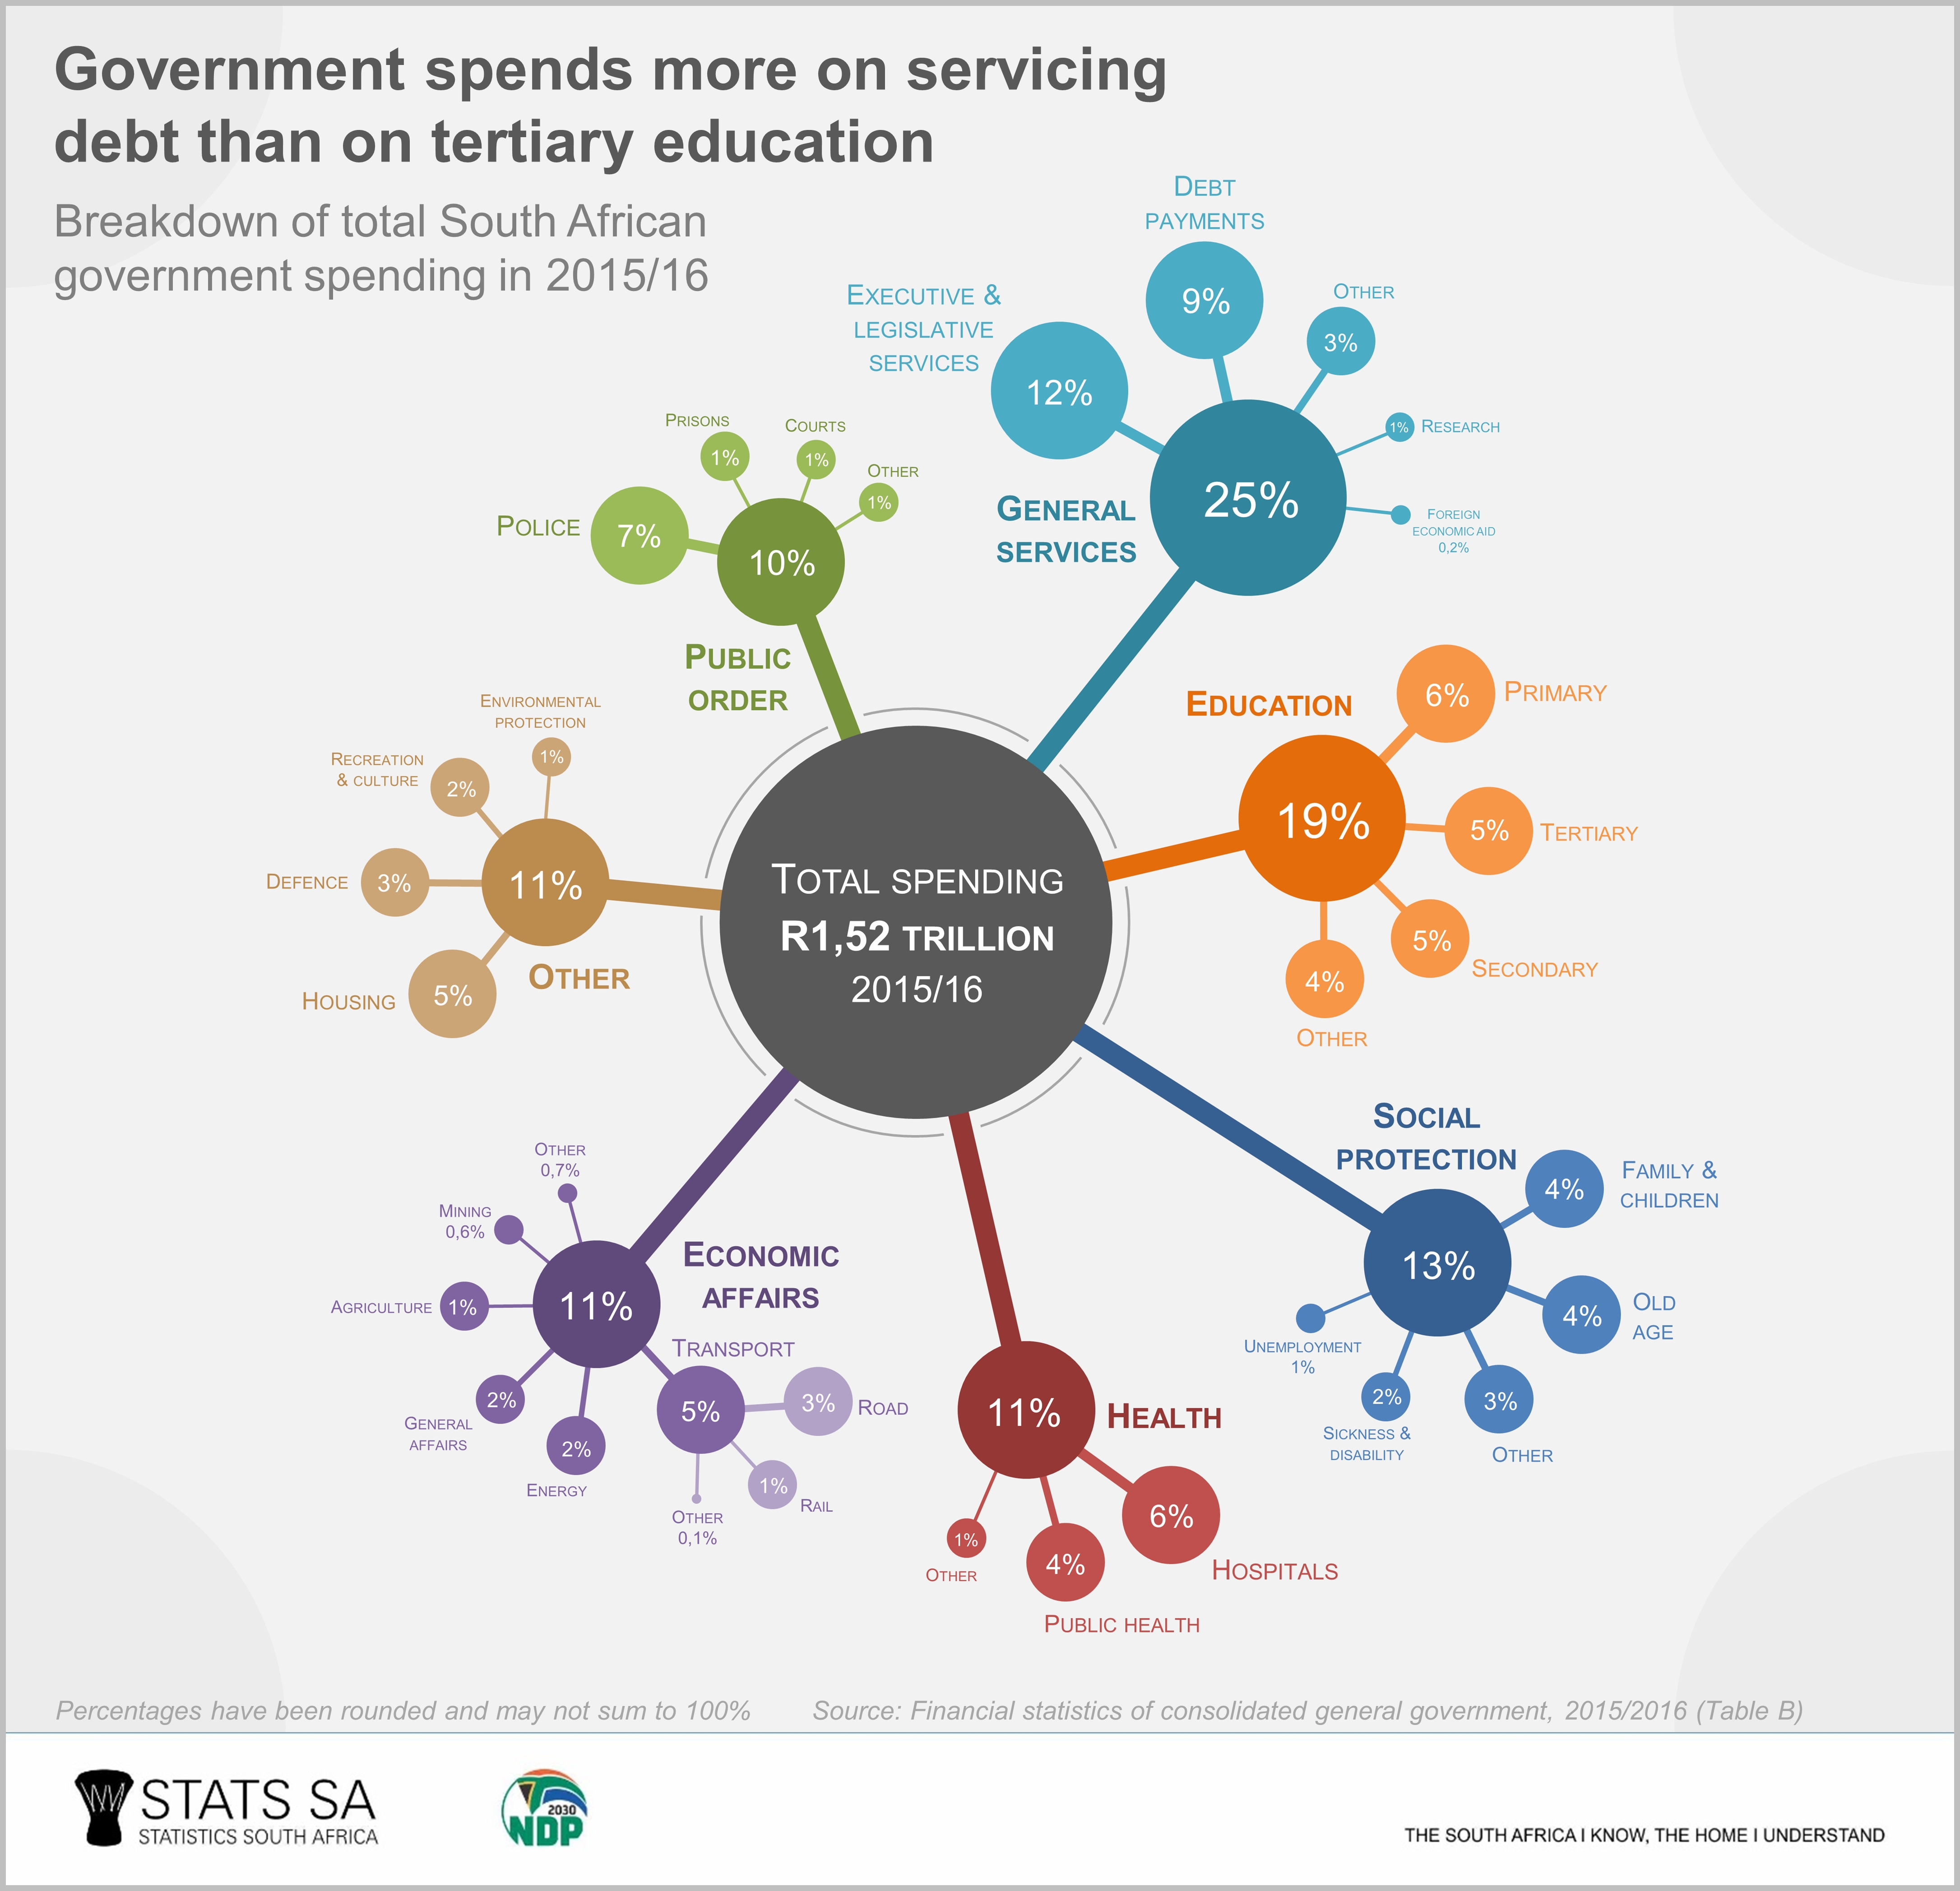
According to the latest Financial statistics of consolidated general government report,1 general services accounted for a quarter of government spending in 2015/16 (click on the infographic to enlarge). Within this, debt payments accounted for 9% (of the total) and executive, legislative and financial services accounted for 12%. The latter includes the funding of general government services provided by institutions such as SARS, the National Treasury, the Auditor-General of South Africa (AGSA), the Financial and Fiscal Commission (FFC), parliament, and the various legislatures.
Not surprisingly, big priorities for government are education and social protection (which includes the payment of social grants). Together these two items contributed 32% of total spending.
Total government spending amounted to R1,52 trillion in 2015/16. To put this into perspective, that’s an average of R27 600 per person if we consider South Africa’s population of 54,96 million people (2015 estimate).2
If you look a little closer at the infographic, you will notice that government spent more money on servicing its debt than it did on items such as housing, police, tertiary education and hospital services. Almost R129 billion was spent on public debt payments in 2015/16.
In fact, the contribution of debt payments has slowly crept up over the years. In 2011/12, it was 7,2%, rising in 2012/13 (7,4%), 2013/14 (7,8%) and 2014/15 (8,4%). In 2015/16 it rose only slightly to 8,5% (rounded off to 9% in the infographic).
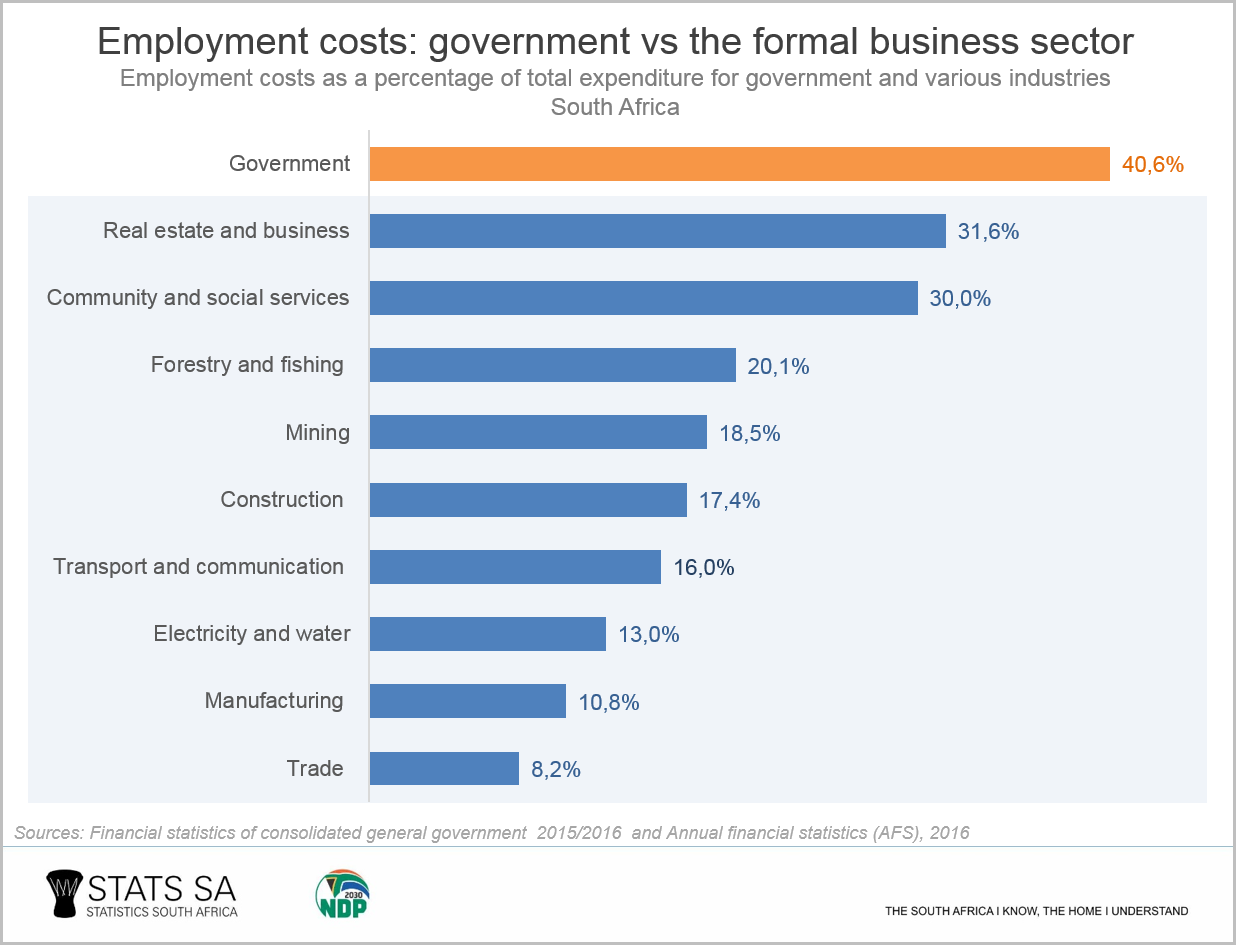
While the infographic breaks expenditure down by function, spending can also be expressed in economic terms, providing an indication of how much money was paid towards salaries and goods and services. If we remove capital expenditure from the R1,52 trillion in 2015/16, we’re left with R1,37 trillion.
Compensation of employees contributed 40,6% of the R1,37 trillion, the largest expenditure item in economic terms. The second largest item was purchases of goods and services, contributing 21,9%.
How does this compare with other industries? Other than government, real estate and business services recorded the highest percentage of spending on employment costs.3
Where did the South African government get the money to fund the spending outlined above? From taxes, mostly. For the 2014/15 release of the Financial statistics of consolidated government, Stats SA published an article outlining the different types of taxes that government relies on the most.4
Not much changed in 2015/16. For every rand of total revenue generated in 2015/16, 86c was received in the form of tax. Breaking this down further, 29c of the 86c was collected in the form of personal tax, 21c from VAT, 16c from businesses, 10c from excises and 10c from other taxes.
Total government revenue, which includes taxes and other forms of income, amounted to R1,35 trillion in 2015/16. Immediately you can see that, with total spending of R1,52 trillion, the South African government spent more than it earned.
For more information, download the latest Financial statistics of consolidated general government report here.
1 The Financial statistics of consolidated general government report consolidates financial data from five levels of government: national, provincial, local, extra-budgetary accounts and higher education institutions, providing an overarching picture of total government income and expenditure. The report measures the impact of both the economic and functional effect of general government spending, gauging the extent of the cost of certain functions (for example, health, education, defence) against their economic impacts (for example, compensation of employees and interest paid).
2 Mid-year population estimates, 2015 (download the report here).
3 Financial data for the formal business sector are available from the Annual financial statistics (AFS) report for 2016. Download it here.
4 How important is your tax money? (read the article here).
Similar thematic stories are available on the Stats SA website and can be accessed here.