
Which municipalities spend the most per resident?
Turn on a tap. Switch on a light. Take a bus to work. Your daily life is filled with hundreds of small instances where you depend, in some form or another, on services that your city provides, be it running water, electricity or public transport. Which South African municipalities spend the most, per resident, on ensuring that these services are delivered?
Service provision is the primary mandate of South Africa’s 278 municipalities. Total spending by municipalities amounted to R310 billion in 2016, according to Stats SA’s latest Financial census of municipalities report.1 That’s R5 584 for every woman, man and child if we consider South Africa’s population of 55,6 million as it was in 2016.2
Two distinct groupings occur in the data when we look at per capita spending across metropolitan and local municipalities, represented below (click on the graph to enlarge).
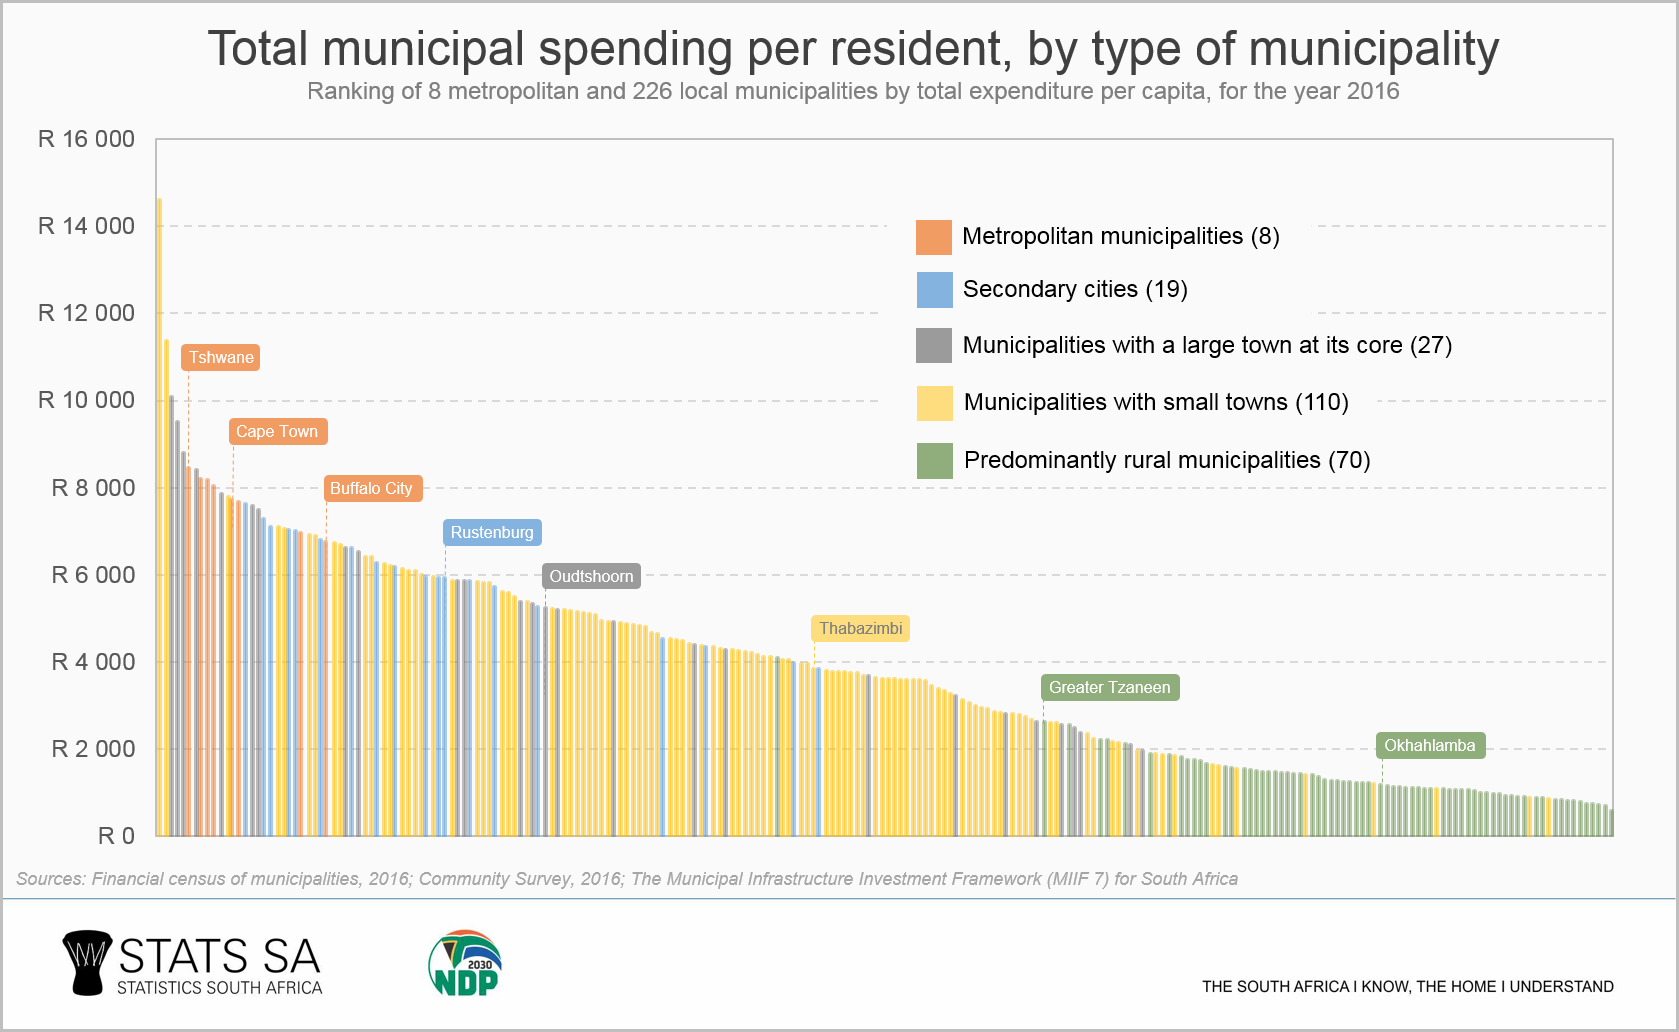
The first cluster are the eight metropolitan municipalities, huddled together in the higher end of the spending range. Four metros spent between R8 035 and R8 446 per resident with Tshwane the top spender, followed by Ekurhuleni, Johannesburg, and Mangaung.
The coastal metros find themselves a little lower down, with Cape Town, eThekwini, Nelson Mandela Bay and Buffalo City falling between R7 708 and R6 742 per resident.
The relative dominance of the metros is not surprising. In 2016, the metros were home to 40% of South Africa’s population but were responsible for 56% of total municipal spending.
What about local municipalities?
The Municipal Infrastructure Investment Framework (MIIF) provides a useful classification of local councils, dividing them into four distinct groups.3 These are: secondary cities, municipalities with a large town as its core, municipalities with small towns, and municipalities that are predominantly rural.
The second distinct pattern that emerges is related to predominantly rural municipalities. These cluster at the lower end (to the right) of the per capita curve. In sharp contrast to metros, rural municipalities were home to 24% of the national population in 2016, but they spent just 6% of the total municipal budget.
Located mostly in KwaZulu-Natal, Eastern Cape and Limpopo, rural municipalities exhibit one striking difference in terms of how they spend their money: they devote very little to purchasing electricity.
Urban municipalities can spend up to a quarter of total expenditure buying electricity from Eskom, which they then resell to residential, business and industrial customers. This process generates a financial surplus that they use to fund other activities.
Many rural municipalities, however, do not take part in the electricity trade. Eskom provides power directly to customers in rural areas without the municipality taking on the middle-man role. As a group, rural municipalities spent only 6% of their budgets on purchasing electricity in 2016, far lower than the national municipal average of 23%.
With Eskom fully responsible for electricity distribution, rural municipalities are not burdened with the high costs associated with infrastructure development and maintenance. District municipalities have also taken over the responsibility for supplying water and sanitation in many areas within KwaZulu-Natal, Eastern Cape and Limpopo.
There does present a major disadvantage. Whereas metros and towns rely on revenue generated from selling services, rural municipalities depend heavily on money from national government. They may be spending less, but rural municipalities miss out on producing an independent income.
1 Download the Non-financial census of municipalities report for 2016 here. Note that the data in the report were collected before the local government elections of August 2016 and thus represent the earlier local government structure consisting of 278 municipalities.
2 Community Survey 2016. Visit the results page here.
3 Download the Municipal Infrastructure Investment Framework (MIIF) document here.
Similar thematic stories are available on the Stats SA website and can be accessed here.