
Which South African metros have the largest (and the most expensive) homes?
If you’re dreaming of one day purchasing a holiday home somewhere on the coast, and space is important to you, Durban might be the best option. On the other hand, if property costs are your main concern, Port Elizabeth or East London might be places to consider.
Stats SA takes a dive into building statistics to find out where the most spacious homes are being built, and what the average construction costs are.
One thing to consider carefully is the type of living space you would enjoy during your vacations. Would you prefer the security of a townhouse near the beach, or the open property of a regular dwelling-house? Or are you happy to live in a high-rise flat with an open view of the ocean?
Building plans with the most generous floor area were approved by eThekwini (Durban), for houses, townhouses and flats. Over a five-year period from 2012 to 2016,1 the average floor area for a dwelling-house in South Africa’s third-most populous city was 233m2 (click on the image to enlarge).
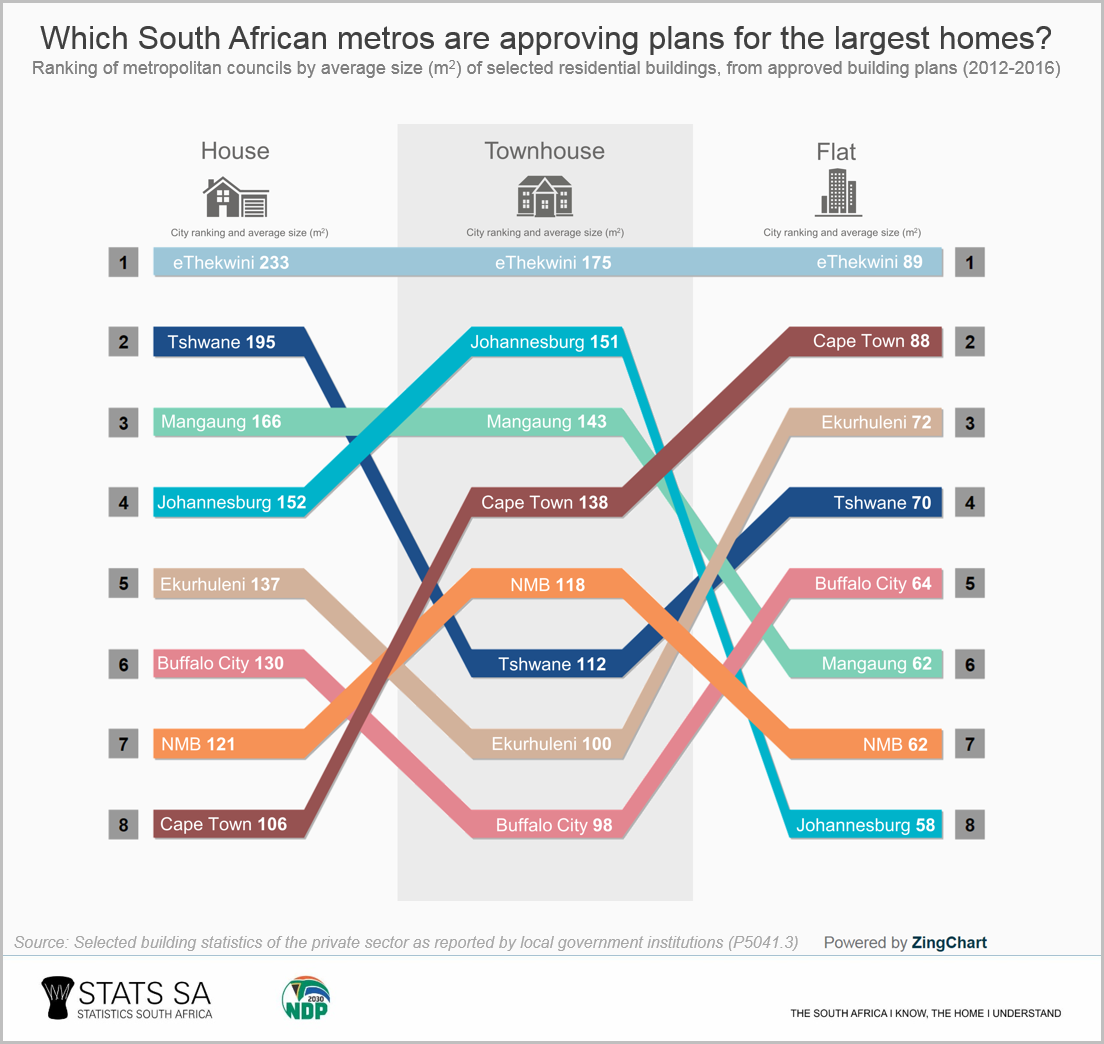
How large is this exactly? Floor plans differ substantially from one another, but to get a rough idea, think of a house with four spacious bedrooms, two bathrooms and a double garage (plus a kitchen, etc.).
Cape Town’s figure for houses might seem unusually small. A closer look at the data show that the city has approved building plans for large numbers of smaller-sized residential units (between 30m2 to 80m2) across the city, in particular in Mitchells Plain and Khayelitsha.
Construction costs in eThekwini are also the most expensive, but only for houses and flats. Tshwane takes the top spot for townhouses; it would cost you an average of R8 575 per square metre to build a townhouse in the capital city, according to data for 2016.
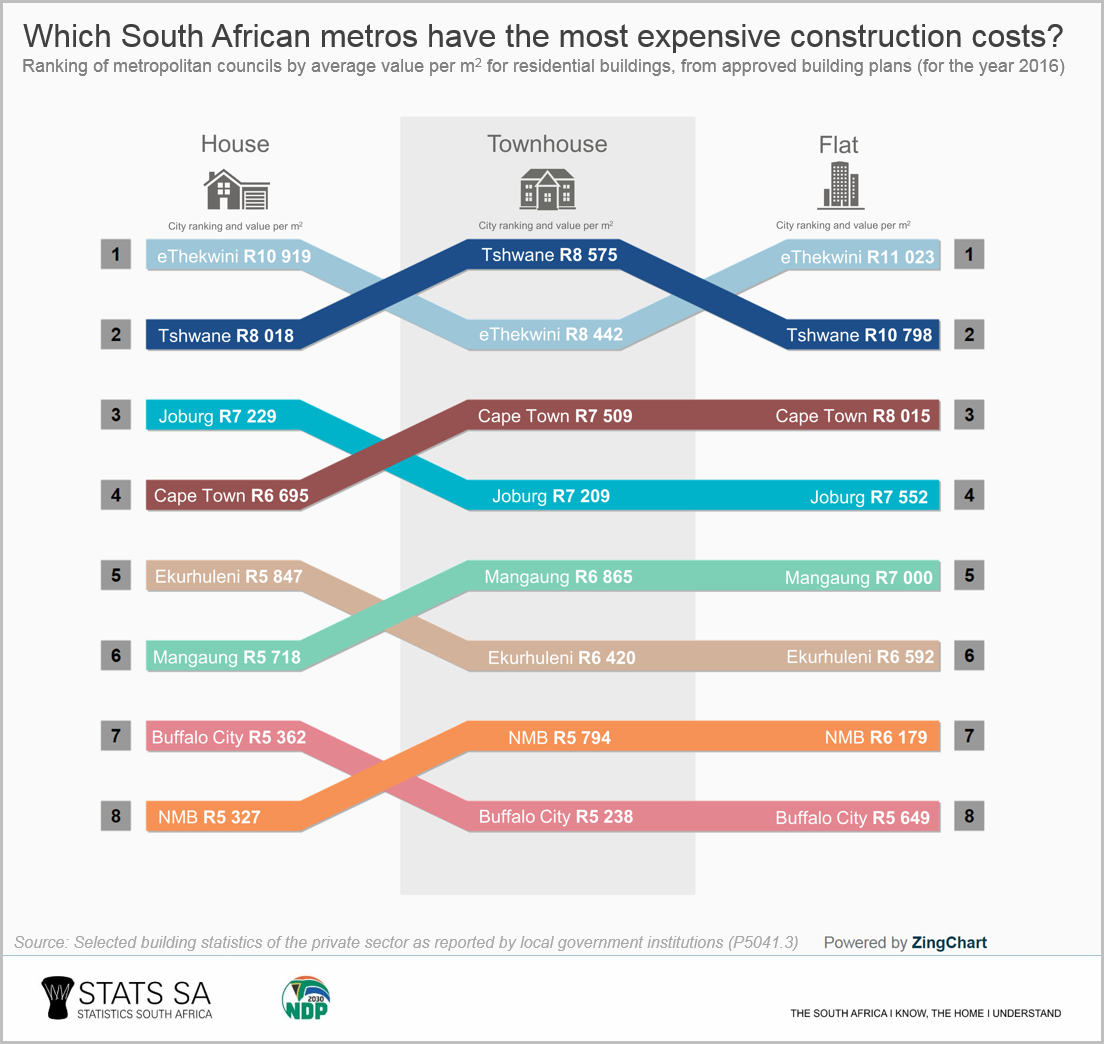
Buffalo City, which includes the coastal city of East London, recorded the lowest costs for townhouses and flats during the same year.
Interestingly, flats have grown increasingly popular in South Africa’s cities over the last couple of years, even outstripping the construction of townhouses. For every 100 plans rubber-stamped for houses in 2013, 26 plans were approved for flats. In 2016, this ratio had risen to 59.
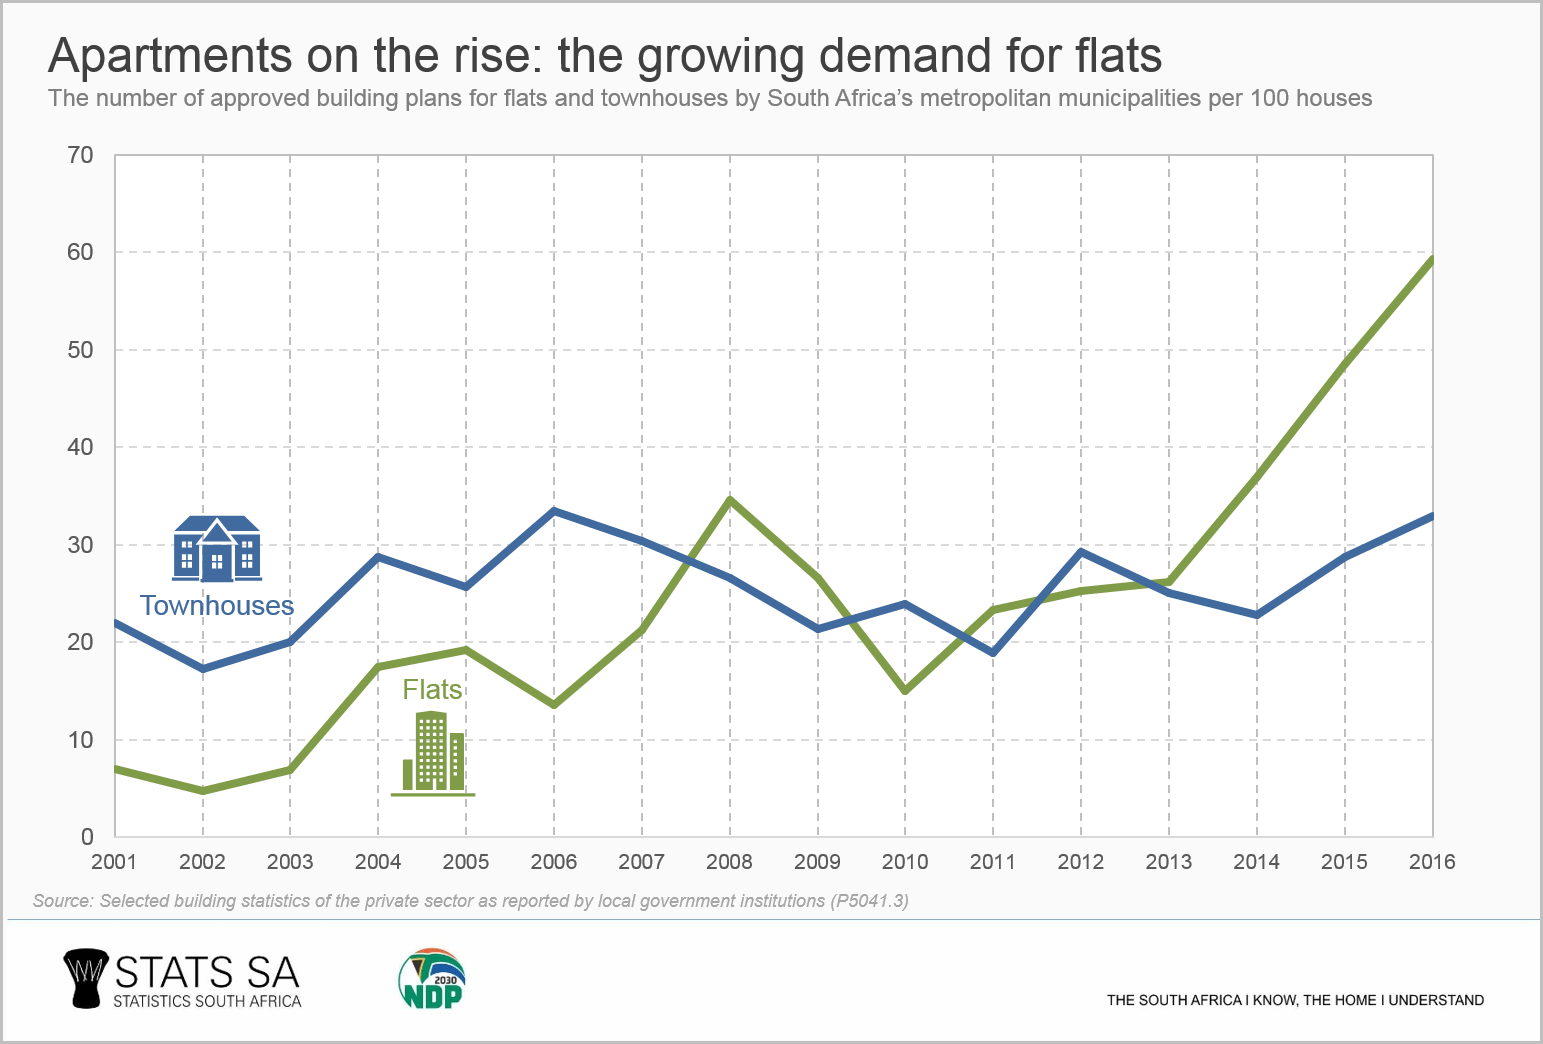
The demand for townhouses has also increased, but not as much. In 2013, the ratio of townhouse plans approved for every 100 dwelling-house plans was 25, climbing to 33 in 2016.
The increasing demand for flats has occurred in nearly all of the eight metros, but particularly in Tshwane, Cape Town and eThekwini. In terms of the capital, one only has to think of recent developments in areas such as Hatfield, Pretoria CBD and around the new Menlyn Maine complex.
Despite the rise in flats and townhouses, houses still dominate the residential landscape. According to the 2016 Community Survey, 64% of households in metro areas lived in formal houses, while 2,6% lived in townhouses and 5,4% in flats.
The metros are home to 40% of South Africa’s population and many people are migrating to the cities in search of work opportunities. The economic hub of Gauteng, which is home to three of the metros, is an especially attractive destination for those seeking employment.
A growing urban population is bound to place pressure on the availability of land for residential development, and it remains to be seen how this will influence the demand for compact living spaces such as townhouses and flats. Whatever lies ahead, the changing residential market is bound to influence your future decisions on where you want to buy a property to live, work and – most importantly – play.
1 Data for this article was sourced from Stats SA’s annual release covering information sourced from larger municipalities (P5041.3). Stats SA publishes building statistics in three publications:
- Selected building statistics of the private sector as reported by local government institutions (P5041.1): This is a monthly release that contains data on building plans passed and buildings completed. Data are sourced from larger municipalities and represent approximately 85% of the national total. Download the latest release here.
- Selected building statistics of the private sector as reported by local government institutions (P5041.3): This release is an annual consolidation of the monthly releases of data from larger municipalities. Download the latest release here.
- Building statistics (Report 50-11-01): The most comprehensive of the three, this annual report includes data on buildings completed for all municipalities (smaller municipalities and larger municipalities). Download the latest report here.
Similar articles such as this one are available on the Stats SA website and can be accessed here.