

Government spending: how much goes to environment protection?
It goes without saying that the natural environment is extremely important to our well-being. Take our rivers and wetlands, for example. The South African National Biodiversity Institute (SANBI), together with Stats SA and other departments, published a document in 2015 outlining the health of the country’s river and wetland systems.
The data do not provide us with any optimism. Overall, river health declined across the country between 1999 and 2011, particularly in the Limpopo Water Management Area.1 If this trend continues, it raises concern about our rivers that carry life into our fields, dams, homes, and factories.
Government is tasked to manage and protect natural resources such as our rivers, including the allocation of funds needed for this cause. In the realm of government finance accounts, spending related to conservation, management of natural parks and reserves, wastewater management and pollution control is classified under the line item of environmental protection.
The South African government spent 0,7% of its total budget in 2014/15 on environmental protection, according to Stats SA’s latest consolidated government expenditure report published in November 2016.2 This amounted to R10 billion out of R1,4 trillion of total spending.
How do we compare with other countries? The proportion spent on environmental protection across 35 countries belonging to the Organisation for Economic Co-operation and Development (OECD) was 1,3%. Those topping the OECD list were the Netherlands (3,2%) and Japan (2,9%).3 Australia’s government spent 2,4% of its total budget on environmental protection, while the United Kingdom devoted 1,8%. The two Latin American countries on the list, Columbia and Costa Rica, both spent 1,4%.
Of course, South Africa has its own unique set of priorities that determines how government spends its money. The largest expenditure item for the South African government in 2014/15 was education, taking up 19,0% of total spending. Other notable items included social protection (13,1%), health (11,2%), interest payments on debt (8,2%), police (6,6%) and defence (3,0%). All these were above environmental protection’s contribution of 0,7%.
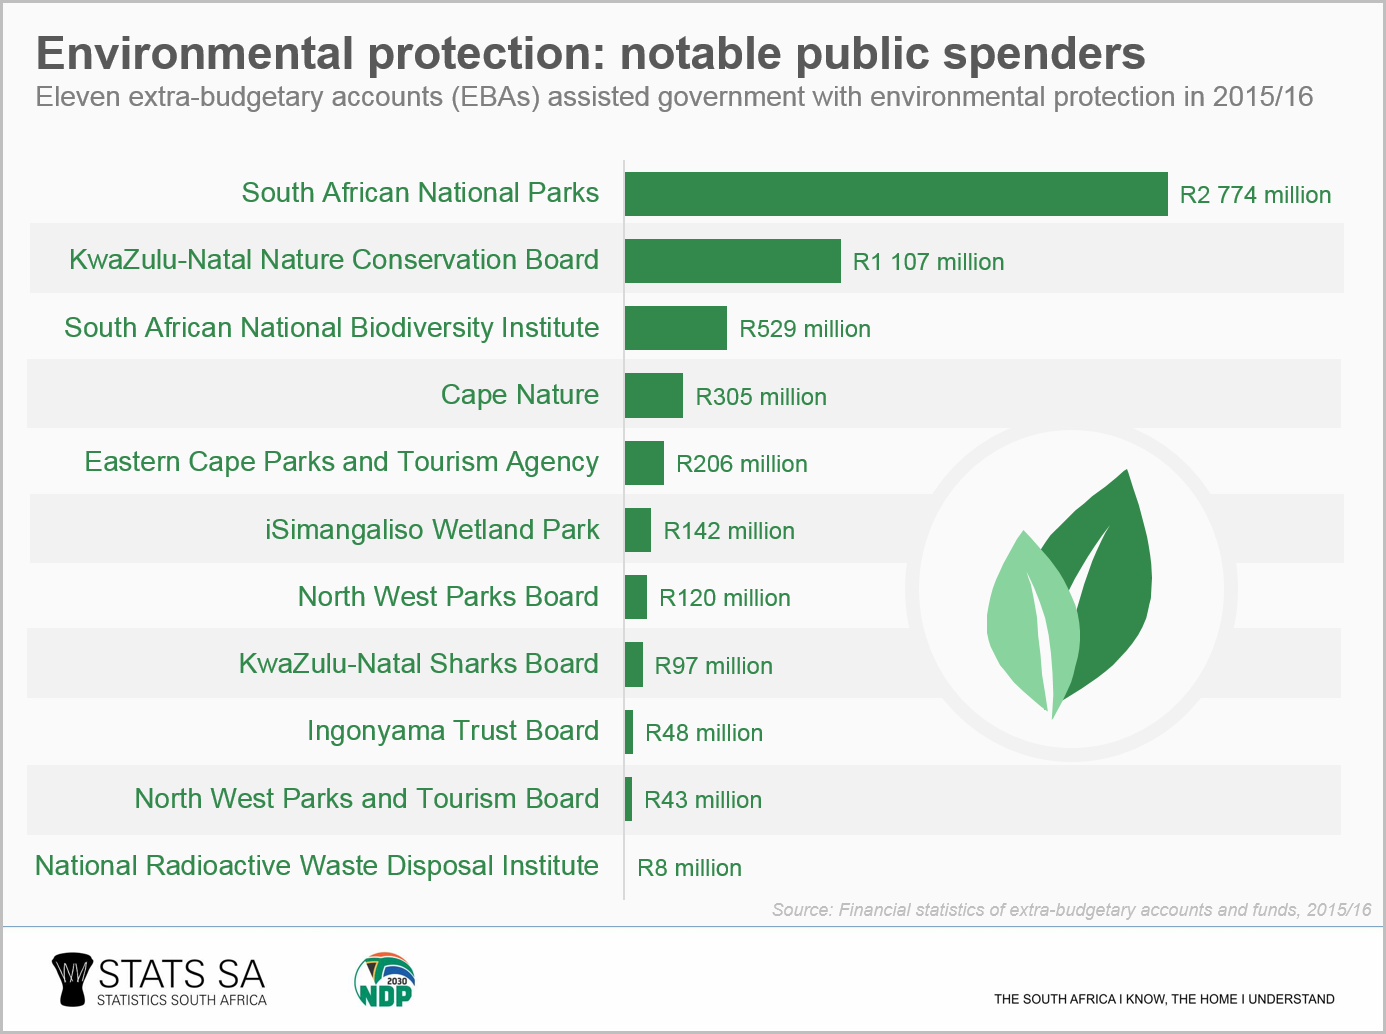
Diving further into the data, it quickly becomes apparent that only a handful of government institutions shoulder the bulk of the responsibility for environmental protection. The function is carried out across all levels of government, but the main players are national government and extra-budgetary accounts (EBAs).
EBAs are public entities that perform an integral role in delivering services to government or to the public on behalf of government. There are 251 EBAs in total. Examples include the South African Revenue Service (SARS), the National Lotteries Board, the Road Accident Fund, and the Public Protector.
Focusing on the R10 billion related to environmental protection in 2014/15, national government spent 21% of this amount, with the Department of Environmental Affairs the main spender. The major players, however, are eleven EBAs that were responsible for the bulk of the spending: just over half of the R10 billion.
In 2015/16, the eleven EBAs involved in environmental protection spent a total of R5,4 billion, according to updated figures released in Stats SA’s latest Financial statistics of extra-budgetary accounts and funds report. South African National Parks was the top spender, followed by the KwaZulu-Natal Nature Conservation Board.
Most of the spending, namely R5,3 billion, was directed to the protection of biodiversity and landscapes. Research and development received R97 million and waste management R8 million.
EBAs have increased their spending on environmental protection over the last five years, from R4,2 billion to R5,4 billion. However, there was a slight drop in expenditure (by R183 million) in 2015/16 compared with 2014/15. This was mainly caused by a decrease in spending by South African National Parks and SANBI.
For more information, download the Financial statistics of extra-budgetary accounts and funds, 2015/2016 report here.
1 National River Ecosystem Accounts for South Africa (read the article and download the complete report here).
2 Financial statistics of consolidated general government, 2014/2015 (download here).
3 OECD, Government at a Glance 2017. Structure of general government expenditures by function 2015 Excel file (download here).
Similar thematic stories are available on the Stats SA website and can be accessed here.