

IMPROVING LIVES THROUGH DATA ECOSYSTEMS
The world of work
Labour market information relates to three groups of individuals, those that are employed, those that are unemployed and those that are not economically active (e.g. homemakers, retirees and full-time students who do not wish to work).
The most recent QLFS results show that in the first quarter of 2013, of the total population in the country, 33,2 million were aged 15-64 years. It is within this age group – the working age population – that labour market patterns and trends are established. In Q1:2013, 13,6 million people were employed, 4,6 million did not have a job but were actively looking for work and available to do so and the remainder (12,7 million) were not economically active.
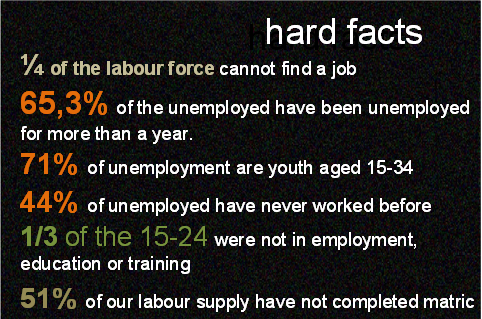
The unemployment rate based on the official definition was 25,2% (Figure 1). This key labour market indicator measures the people who are unemployed, looking for work and available for work as a percentage of the labour force – where the labour force includes both the unemployed and those already in employment. Based on the expanded definition – which only requires unemployed persons to be available for work – the unemployment rate was 36,7%.

Among women, the unemployment rate was 27,5% compared with 23,4% among men while in terms of population group the rate among Africans/Blacks was four times that of whites. Education continued to play an important role in labour market outcomes. Three out of every five unemployed persons had education qualifications below the matric level.
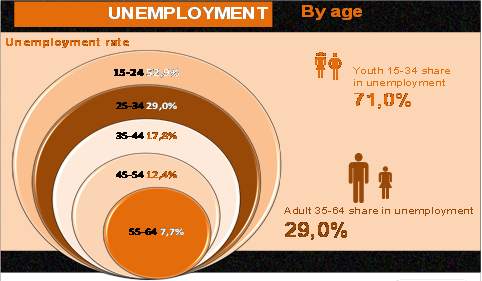
In common with the pattern of unemployment rates across the globe, the youth unemployment rate at 52,9 percent in Q1: 2013 (official definition) is substantially higher than adult rates (Figure 2).
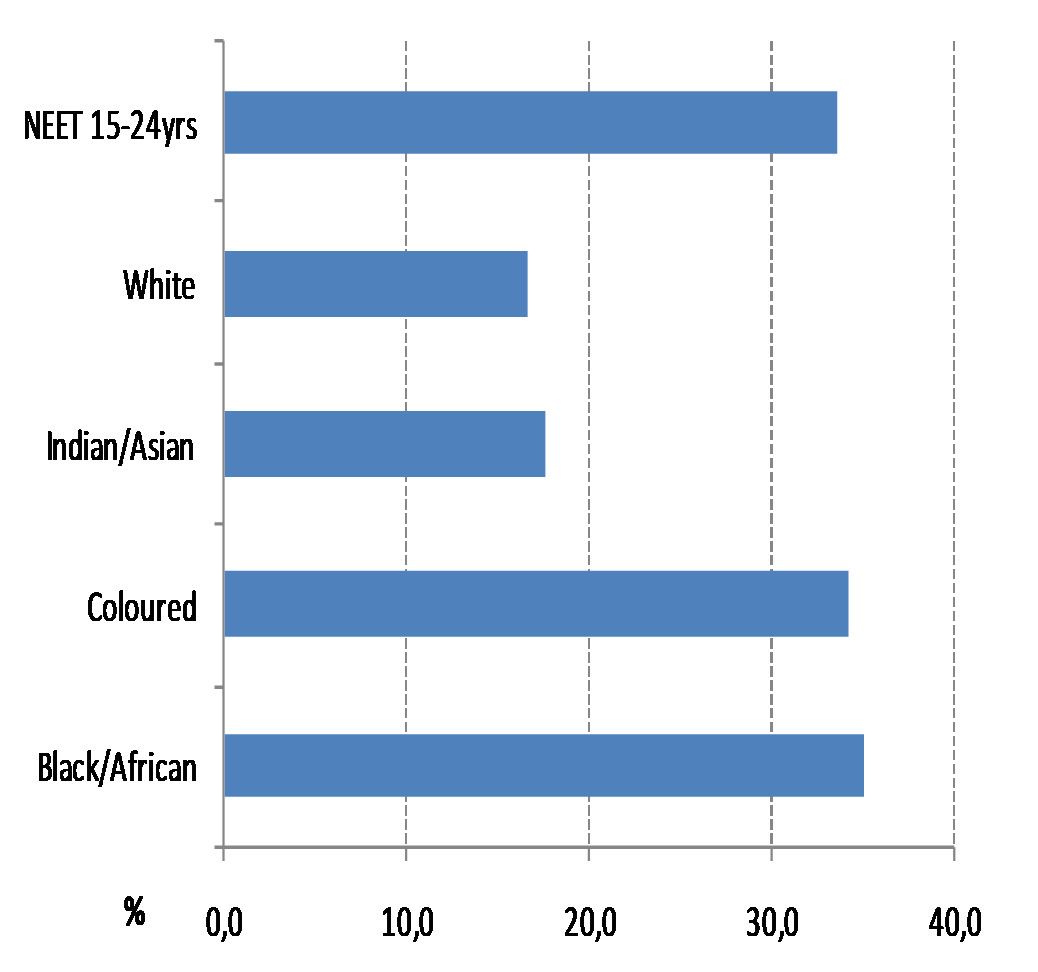
The social consequences of exclusion faced by people who are not in employment and not in education or training (NEET) have been globally acknowledged with the introduction of a new indicator to monitor their situation. In this regard, young people are particularly vulnerable. In South Africa, for 3,5 million youth aged 15-24 years who were not employed and not in education/training the situation continues to be particularly bleak. Among these young people over 30% of both Black/Africans and Coloureds are NEET, while less than 18% of either Indians or whites fall into that group (Figure 3). Gender differences are also evident. Whereas among male youth, 30% are NEET, among female youth a higher percentage (37%) face the risk of social exclusion.
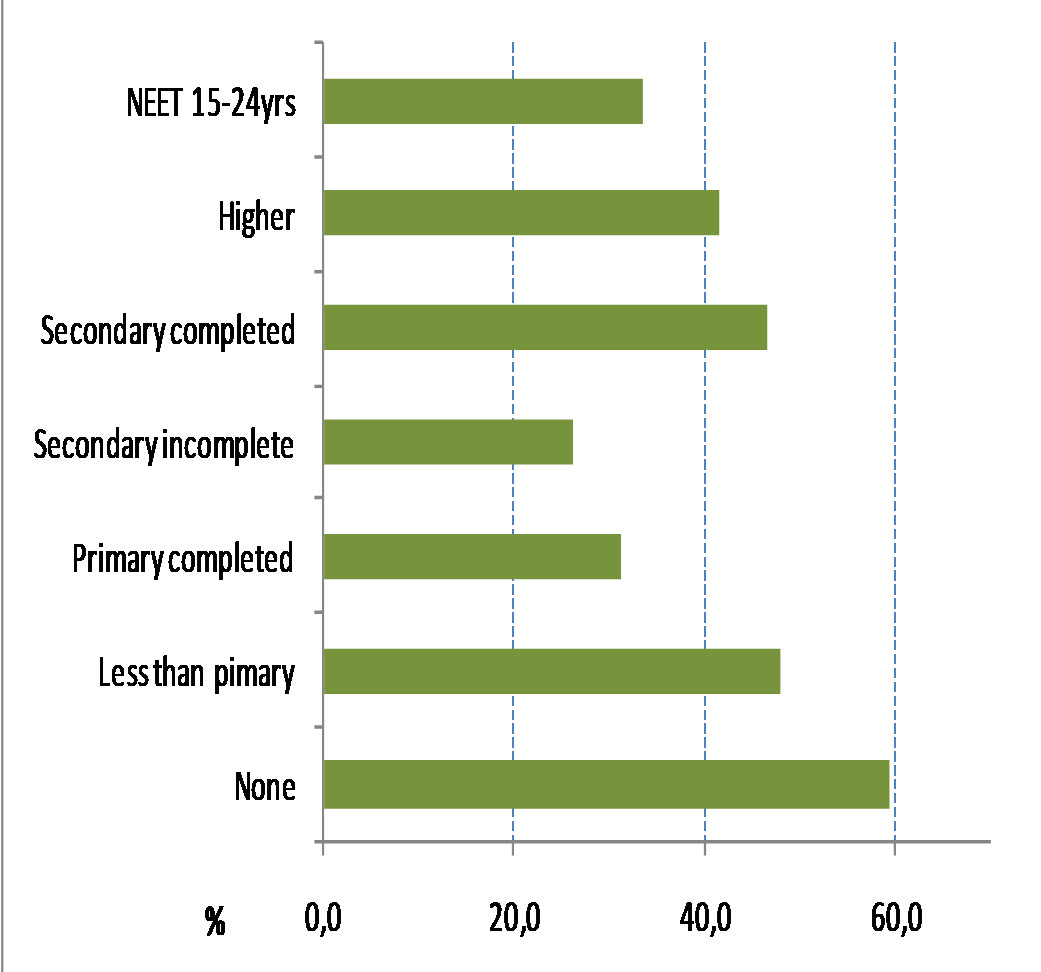
In terms of education level, among 15-24 year old youth with no education, three out of every five are NEET. At the higher end of the educational spectrum, among 15-24 year olds with tertiary education, 41,5% are NEET (Figure 4). The problem here is clearly the lack of employment opportunities, although it may also reflect a mismatch of skills in the labour market. In any event, this group is relatively small in terms of absolute numbers accounting for fewer than 4% of NEET youth.
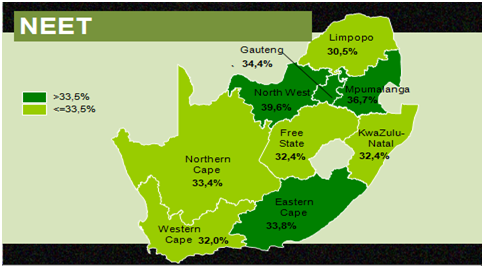
In every province, over 30% of young people aged 15-24 is NEET – ranging from 30,5% in Limpopo to 39,6% in North West (Figure 5).