
Women in power: what do the statistics say?
The message was clear: “We’ve had enough!” Regarded as one of the largest demonstrations at the time, more than 20 000 women marched to the Union Buildings on 9 August 1956 to protest against the apartheid government’s pass laws.
This powerful statement of protest brought the struggle for women’s rights to the fore, and signified a critical point in the fight for a non-racist and non-sexist South Africa. As a nation we now celebrate this historical march in the form of Women’s Month in August.
How far have we come in the last 61 years in instilling gender equality? We take a look at the numbers.
There are more women than men in South Africa. A meetup of 1 000 people that perfectly represents the country’s population of 56,5 million would consist of 511 women and 489 men. In other words, women comprise 51% of the total population1.
Despite women making up just over half of the population, they remain relatively unrepresented in positions of authority and power. This is recognised by South Africa’s Constitution, which sets out gender equality as a founding principle. The Women Empowerment and Gender Equality Bill in particular calls for 50% representivity in decision-making positions.
If we consider the entire workforce, 44 in every 100 employed individuals are women, according to labour data released for the second quarter of 20172. Women fill 44% of skilled posts, which includes managers, professionals and technicians. This figure hasn’t shifted much over the years; it was 44% in September 20023.
Although South Africa has made great strides, gender representivity is still below the 50% mark for positions that come with a great deal of influence, according to data from 20144. Women comprised 32% of Supreme Court of Appeal judges, 31% of advocates, 30% of ambassadors and 24% of heads of state-owned enterprises. If we take a brief look at the Top 40 JSE listed companies, only one company had a female CEO.
Parliament fares a lot better. South Africa is ranked as the tenth country in the world with the most number of females in parliament5, according to the Inter-Parliamentary Union, with just over 4 in every 10 benches held by a women.
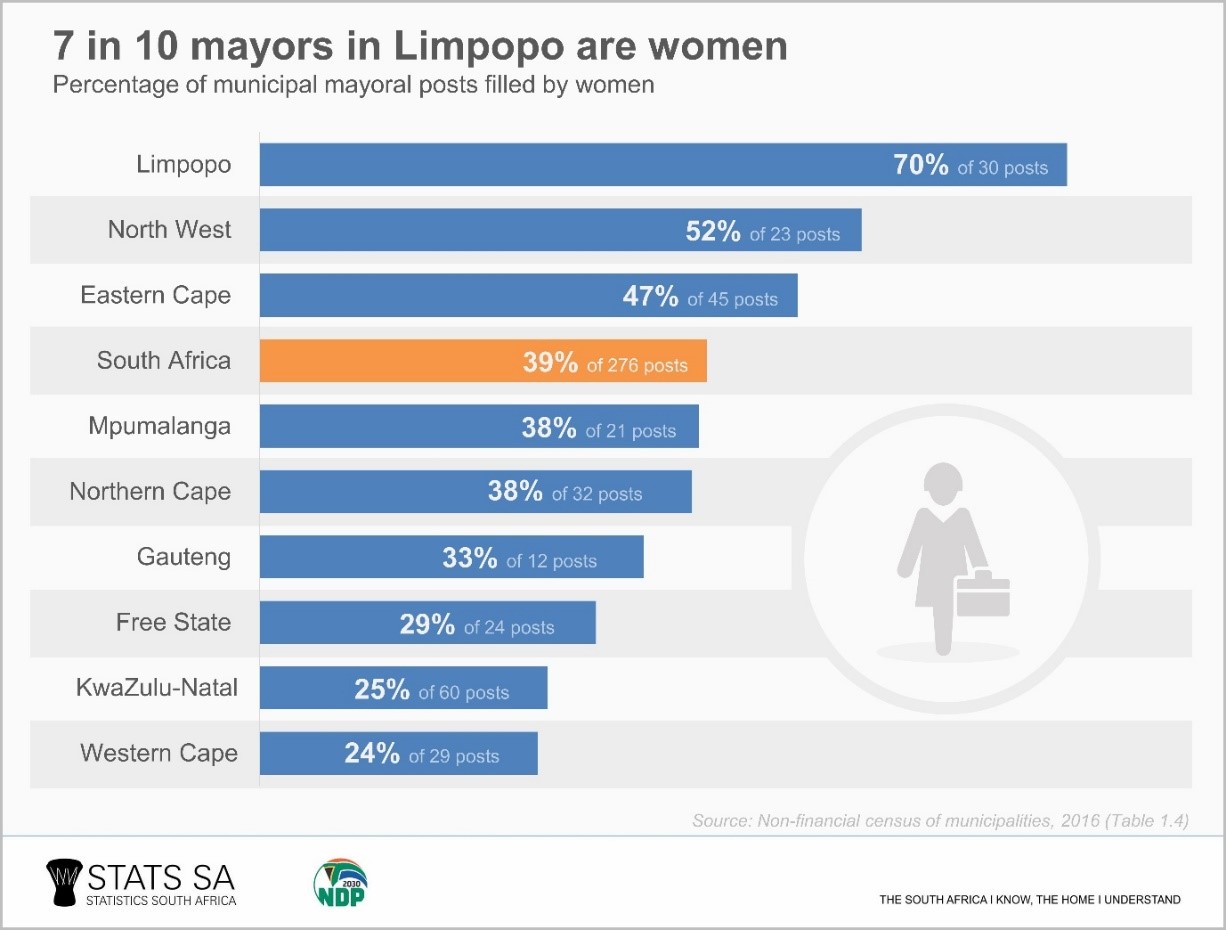
What about city and town councils? In 2016, 276 of South Africa’s 278 municipalities had a sitting mayor6. Of these, 107 (or 39%) were female, slightly lower than the 42% recorded in 20117. Municipalities in Limpopo led the charge in gender equality, followed by North West and Eastern Cape.
South Africa has made progress towards the realisation of a non-sexist society, but there is still a way to go before the aspirations of those who took part in the Women’s Day march of 1956 are fully realised.
1 Mid-year population estimates, 2017 (download here).
2 Quarterly Labour Force Survey, Quarter 2, 2017: Table 3.5 (download here).
3 Labour Force Survey, Historical Revision, September Series 2000 to 2007: Table 4.3 (download here).
4 Gender series volume I: Economic empowerment, 2001–2014 (download here).
5 Inter-Parliamentary Union, Women in Politics, 2017 (download here).
6 Non-financial census of municipalities, 2016: Table 1.4 (download here).
7 Non-financial census of municipalities, 2012: Table 1.4 (download here).