Beer more popular than vegetables
Beer more popular than vegetables
Nqa, Impilo, Pholo e ntle, gesondheid, Awe, Cheers!
Many of us enjoy a pint, but have you ever really thought much about the industry and what you spend on your beer?
In celebration of International Beer Day, we take a closer look at how much households spend on beer and how the price of your favourite brew has shifted over the last while.
Beer has remained relatively flat (in terms of price, hopefully not your actual beer!) Beer inflation – for both rural and urban areas – climbed 0,3% in June 2017 compared with June 2016, way below the overall annual inflation rate of 5,0%.
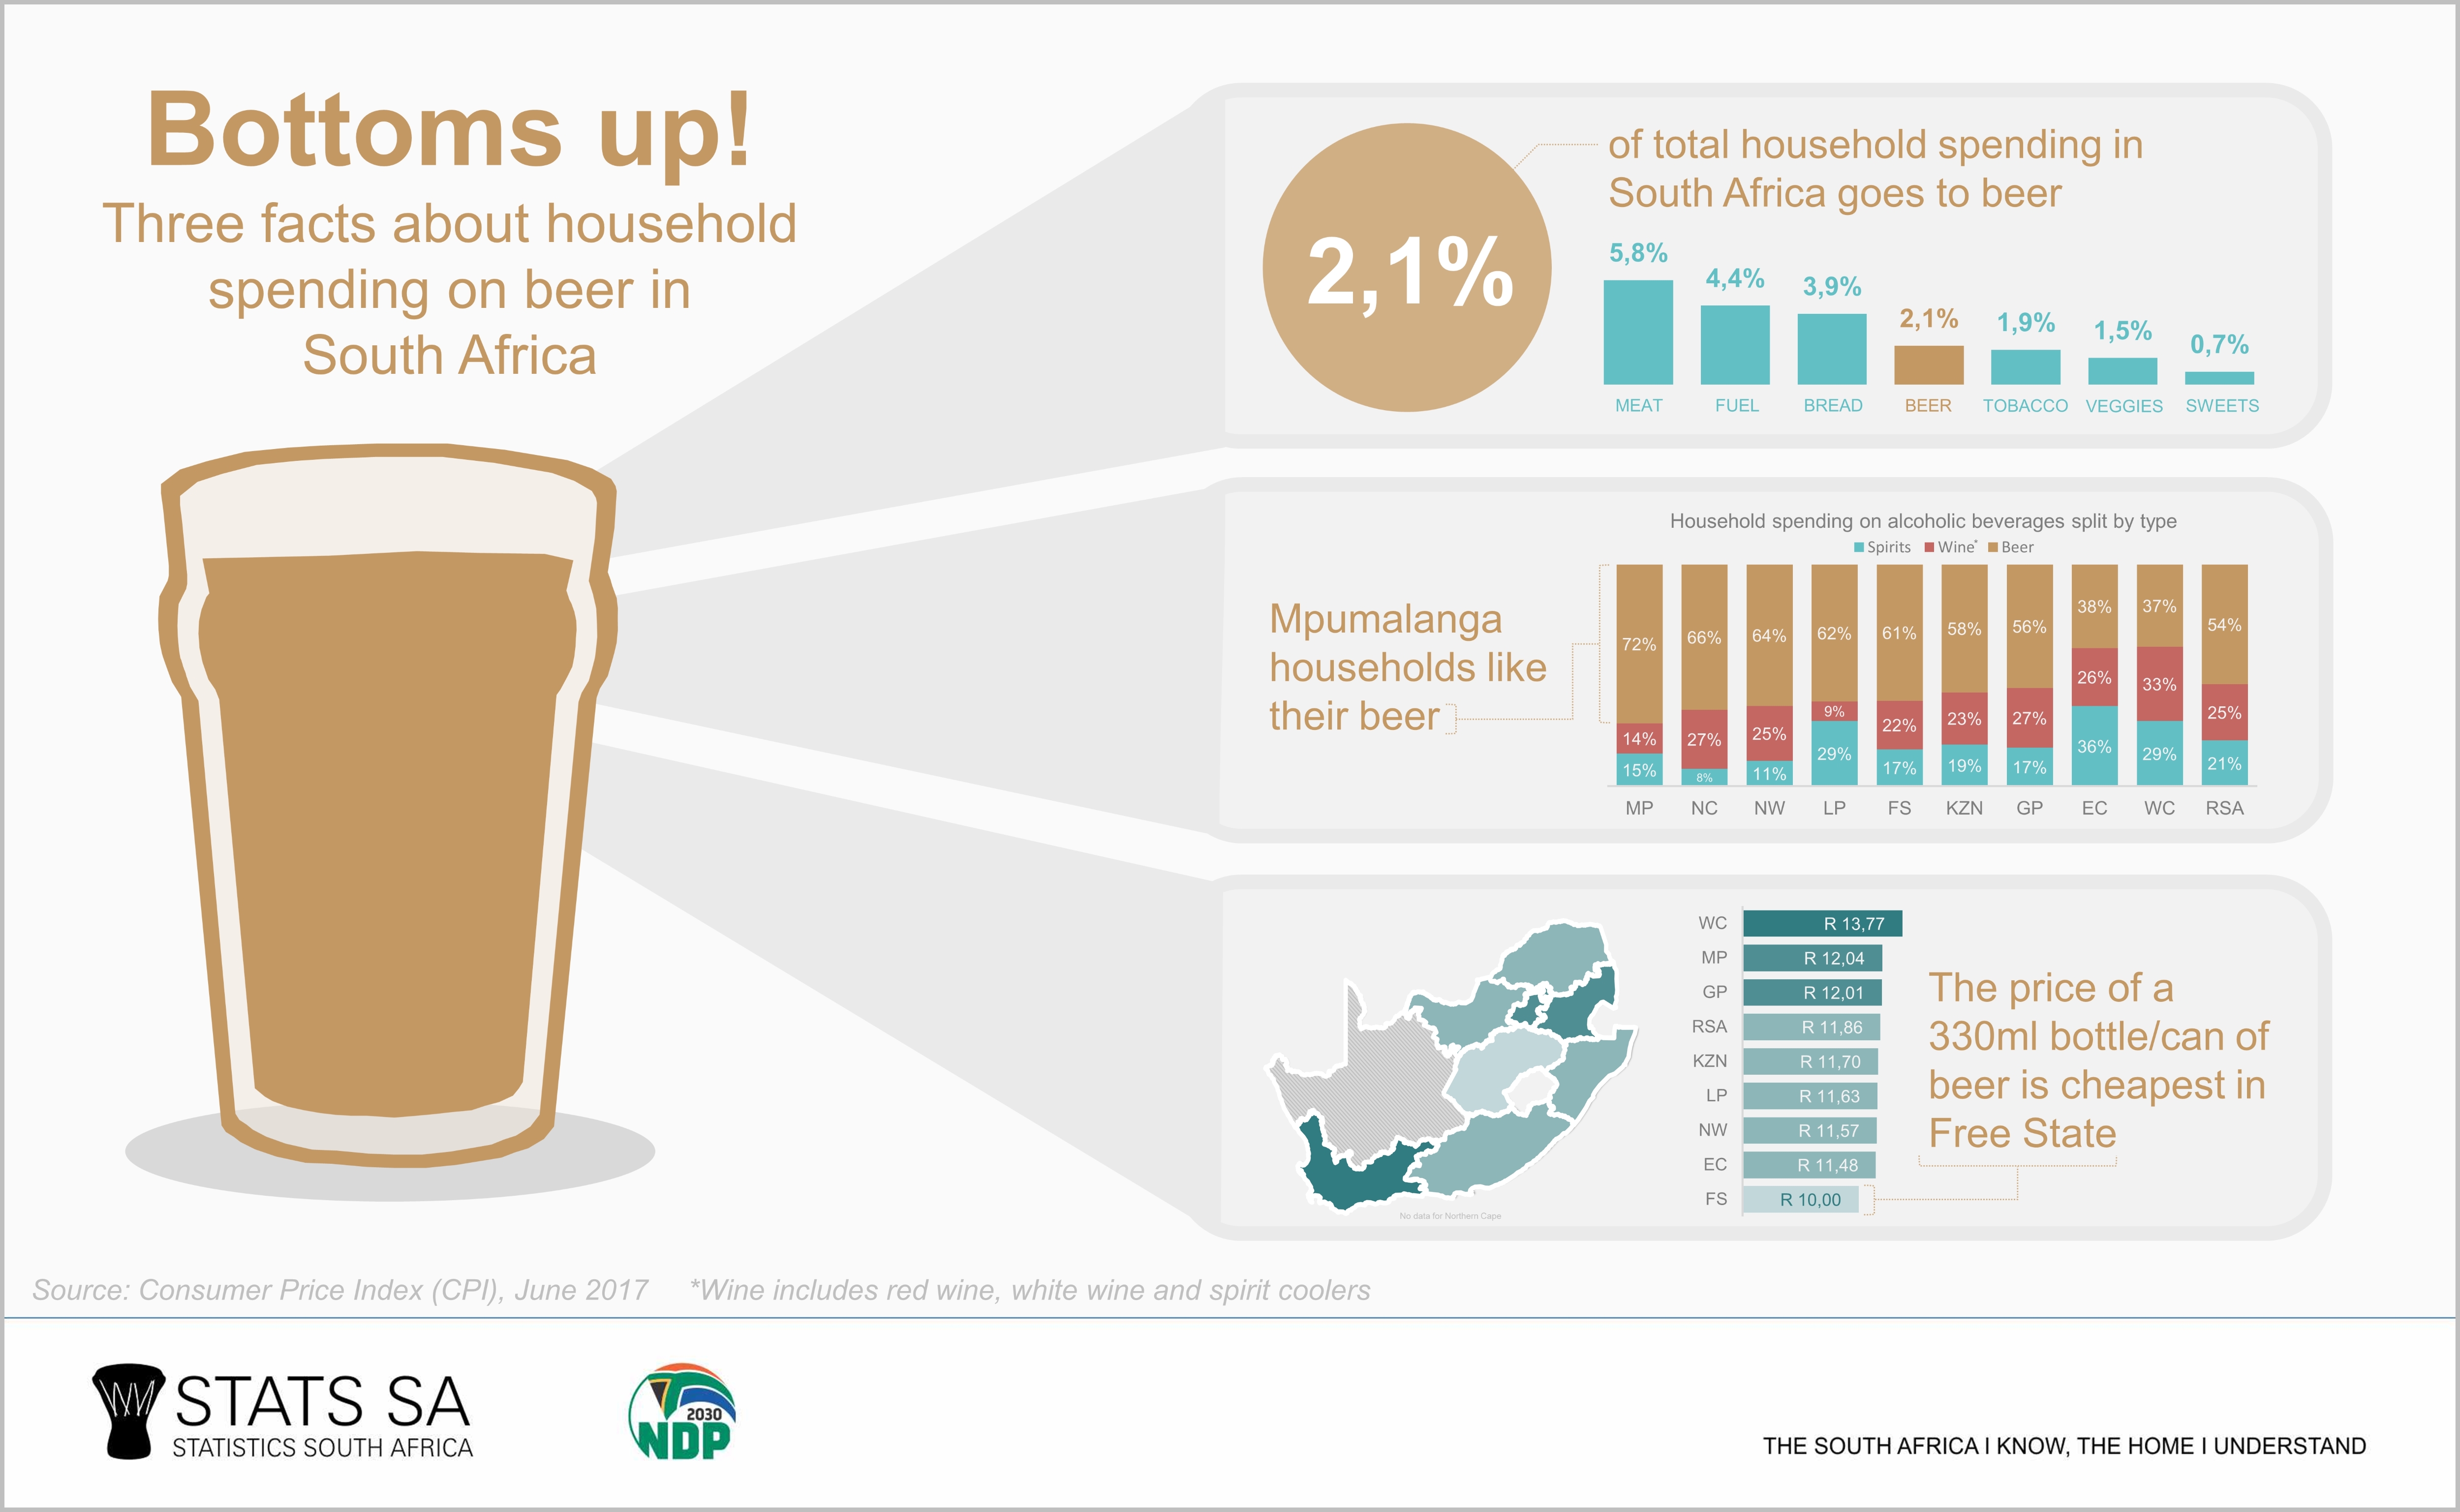
The average price of a single 330ml bottle or can, for example, was R11,86 in June 2017, the same as what it would’ve cost you in January 2017. If you prefer to buy in bulk, the average price for a six-pack of 330ml bottles or cans was R61,27 in June 2017, R1,49 cheaper than the price recorded for January. This is despite the rise in the sin tax on beer in April.
Beer drinkers living in Western Cape have it a bit tougher than those enjoying a glass elsewhere. The average price of a 330 ml bottle or can in Western Cape was R13,77 in June 2017, R3,77 more expensive than that recorded for Free State, where beer was the cheapest.
How much do South African households spend on the beverage? The consumer inflation weights published by Stats SA in December 2016 (for the total country) provide some insight into beer that is consumed at home. Beer accounts for 2,1% of total household spending. This is the same as what is spent on personal care (2,1%), but higher than tobacco (1,9%), vegetables (1,5%), sweets and desserts (0,7%) and fruit (0,3%).
Stats SA measures price changes for three categories of alcoholic drink: beer, wine (which includes red wine, white wine and spirit coolers) and spirits (brandy, whiskey, liqueur and vodka). Of the three, beer is the most popular. Over half of household spending (54%) on alcoholic beverages is devoted beer. Wine and spirit coolers come in second at 25% and then spirits at 21%.
Beer is the most popular choice in all provinces. Households in Mpumalanga are great fans: they spend 71% of their alcoholic beverage budgets on beer. Northern Cape is in second spot (66%), followed by North West (64%). Despite being the most popular choice, beer faces some competition from wine and spirit coolers in Western Cape and spirits in Eastern Cape.
Happy International Beer Day, enjoy responsibly!
Download the latest Consumer Price Index (CPI) release here.
Similar thematic stories are available on Stats SA’s website and can be accessed here.