
Electricity infrastructure dominates capital spending
Recent data released by Stats SA show that public-sector capital expenditure has risen over the last five years, from a total of R203 billion in 2012 to R284 billion in 2016; an average rise of 8,7% per year. Over R1,2 trillion was spent during this five-year period.
Well-maintained infrastructure facilitates trade, improves connectivity, attracts investment, and allows communities to access services.
One significant positive spin-off is improved efficiency. Better roads, better equipment and better buildings allow industry, business and the workforce to be more productive.
Think of a plumber who relies on completing jobs across a city to make ends meet. A decent road infrastructure – characterised by good surfaces, a large number of lanes, traffic lights that are well maintained, and adequate drainage – contributes to lowering travel congestion and shortening travel times. This enables the plumber to maximise the number of locations visited in a day, allowing for more jobs to be completed and more revenue to flow in.
You can imagine the cumulative impact of this across all activities and players in the economy. Increased productivity, brought about by improved infrastructure, in turn leads to higher standards of living.
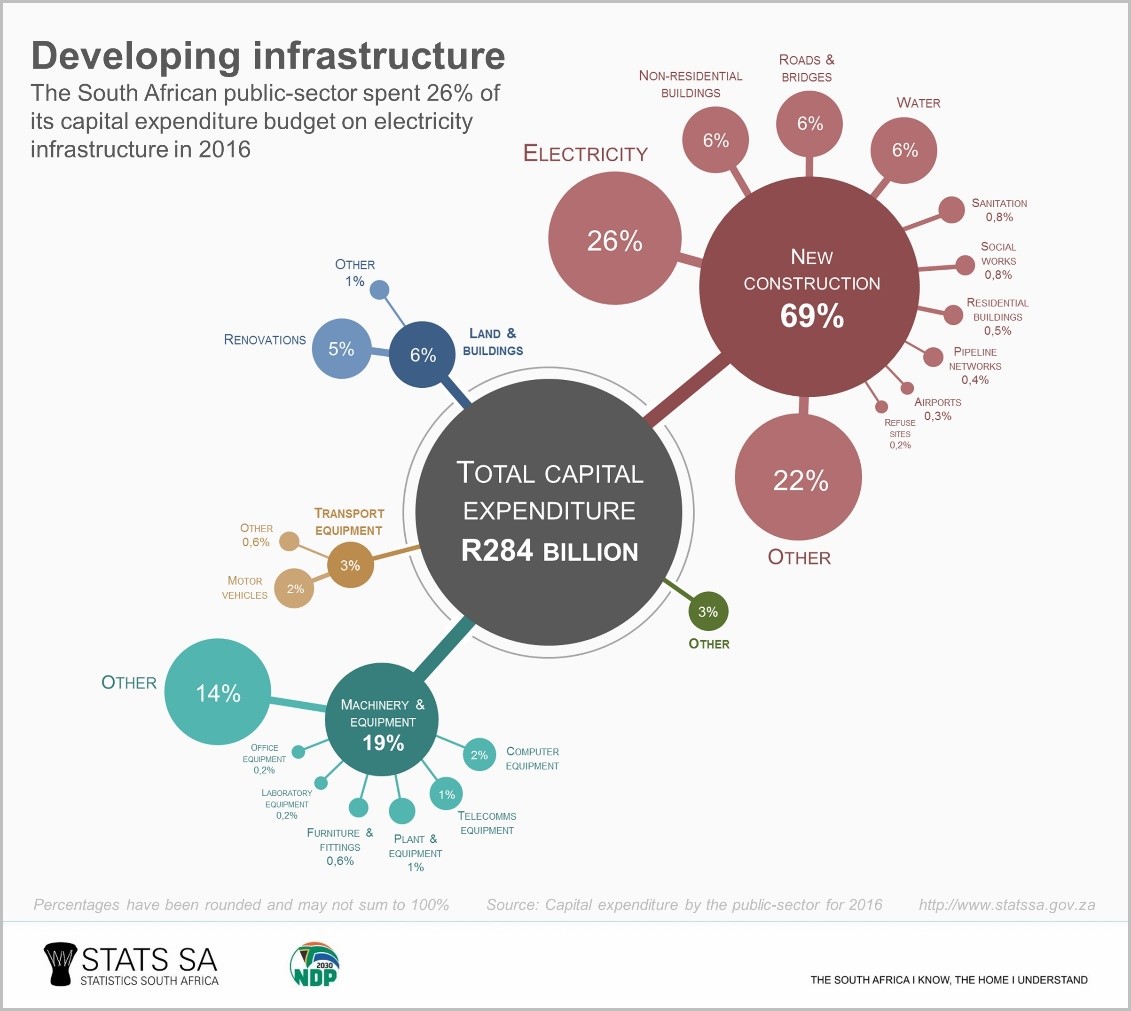
The theory aside, let’s look a little closer at the data. Stats SA’s latest Capital expenditure by the public-sector report for 2016 provides detail on the types of investment that different spheres of government have made in infrastructure in terms of new construction, machinery, transport equipment, and work done on existing buildings.
For the purposes of the report, public-sector institutions comprise the national government, provincial government, municipalities, public corporations, higher education institutions (such as universities), and extra-budgetary accounts and funds.
In the diagram, notice how investment in electricity trumped all else in 2016. Just over a quarter of public-sector capital expenditure was on new electricity infrastructure. There was a cumulative contribution of 18% from non-residential buildings (6%), roads and bridges (6%) and water (6%) (click the image to enlarge).
Not surprisingly, Eskom topped the list as the biggest capital spender of the 772 public-sector entities covered in the report. The power utility contributed 25,7% (R73,0 billion) to total capital expenditure, focusing mainly on the continued construction of the Kusile and the Medupi power stations, and the Ingula Pumped Storage Scheme.
Transnet was the second biggest spender, focusing mainly on maintaining capacity in its port and rail divisions.
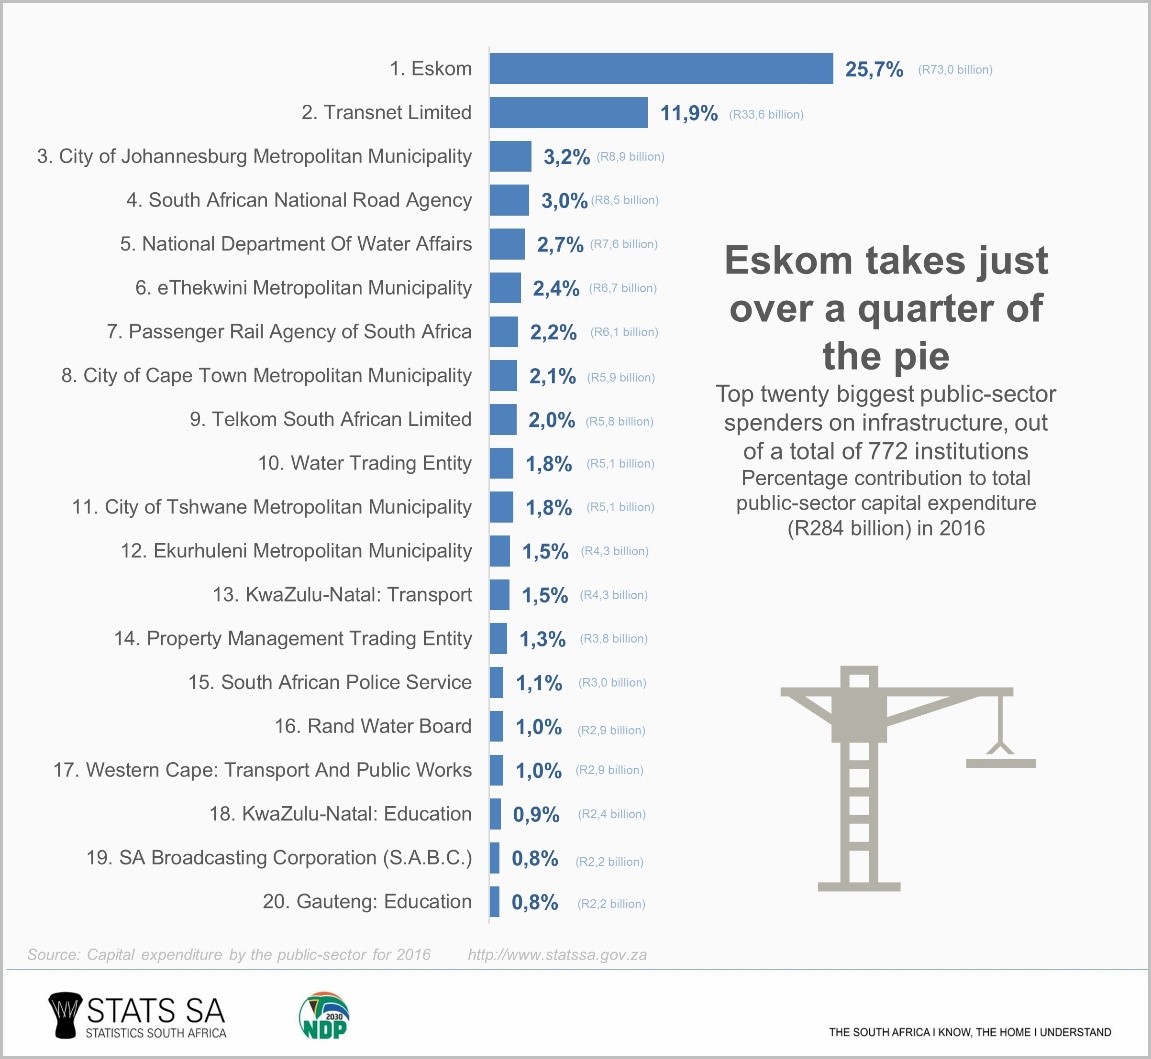
Although there are many players, South African public-sector infrastructure spending is dominated by a few heavy hitters: the top seven spenders above take up half of the total expenditure pie. Almost 72 cents of every rand spent on infrastructure by the top seven was on new construction.
The public sector continues to invest in infrastructure, with particular focus on new construction related to electricity generation. Infrastructural spend also underpins some of the goals of the National Development Plan, in particular the provision of service delivery and infrastructural development.
Download the latest Capital expenditure by the public-sector report, the unit data and media release presentation here.
Similar thematic stories are available on Stats SA’s website and can be accessed here.