
Tighter profits in the formal business sector
The formal business sector, excluding agriculture and banking, generated R2,34 trillion in income during the first quarter of 2017, for the months of January, February and March. On average, that’s R300 560 of income generated every second over that 90-day period.
You might be thinking that’s quite a hefty amount. You might catch yourself imagining the difference it would make to your personal finances if the fruits of just one or two of those seconds could somehow come your way.
But simply taking turnover on its own as a measure of business success doesn’t provide a complete picture. As in all areas of life, costs are inevitable and any turnover generated is quickly eroded by expenses. Stats SA’s two publications on formal business sector finances, the Quarterly financial statistics (QFS) and Annual financial statistics (AFS)5 reports, provide an overview of what South African businesses spend money on in order to stay operational.
Purchases come out on top as the largest business expenditure item, taking up 60 cents for every rand spent in the first quarter of 2017, according to the latest QFS1 report. Employment costs are the second largest item, contributing around 14 cents.
Other items measured (including interest on debt, royalties, hiring of vehicles and machinery, and renting of buildings, to name a few) contribute about 10 cents. The miscellaneous category of expenditure, aptly referred to as “other expenditure”, is responsible for the remaining amount.
After all this spending, amounting to R2,20 trillion, and adjustments for inventories, South African businesses were left with just R145 billion. This is referred to as profit before taxation. If we further remove tax, businesses were left with R112 billion.
This translates to R14 401 per second over the first 90 days of 2017 – a far cry from the R2,34 trillion in income, or R300 560 per second mentioned earlier.
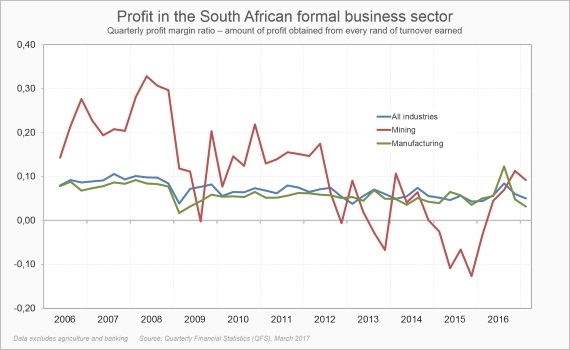
South African business profit has softened over the last decade. Consider the profit margin ratio, a financial measure that tells us how much profit a business obtains from every rand of turnover (or sales) that it generates. The profit margin ratio for the formal business sector declined from a peak of 11 cents for every rand of turnover in the third quarter of 2007 to 5 cents in the first quarter of 2017.
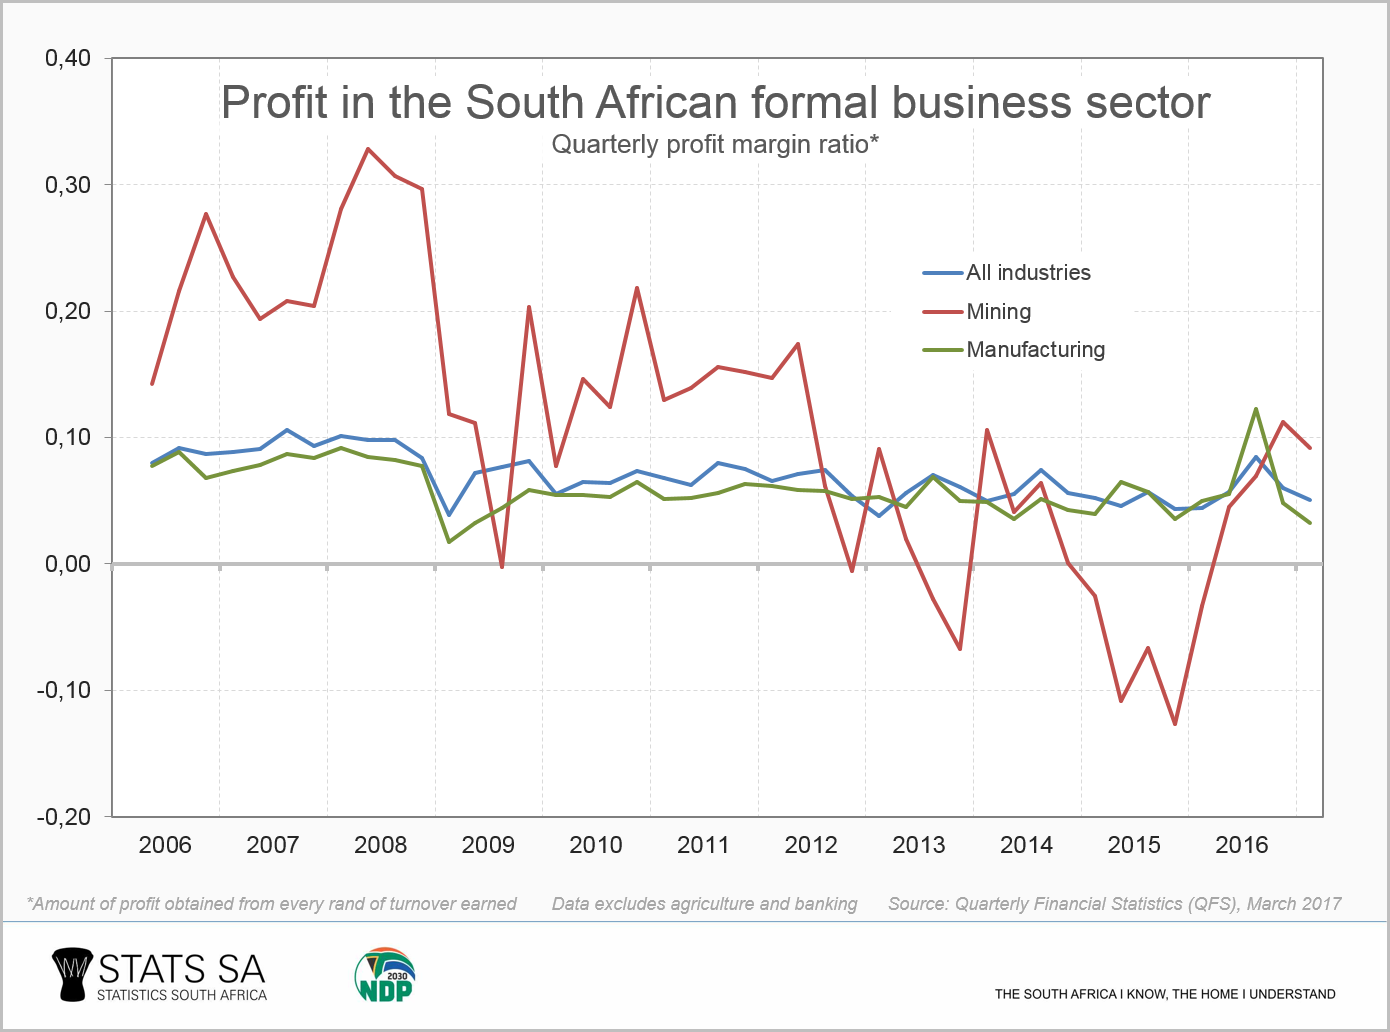
How has the profit margin ratio fared for key industries, such as manufacturing and mining? Combined, manufacturing and mining currently employ just over 2,2 million individuals, 14% of the nation’s workforce2.
According to recent gross domestic product (GDP) figures, manufacturing saw three quarters of consecutive economic decline, contributing to the recession during late 2016 (Q4) and early 2017 (Q1)3. The profit margin ratio for the industry has followed a similar trend to that of the formal business sector.
Once the jewel of South Africa’s economic crown, mining contributed 21% to total South African economic output in 1980, gradually falling to 8% in 20164. Mining’s profit margin ratio has also fallen, although the ratio is very volatile. The industry saw profits as high as 30 cents for every rand of turnover generated, falling to 9 cents in the first quarter of 2017.
Healthy profits make it easier for businesses to expand their operations, invest in the future and in turn hire more employees. Only time will tell if policy interventions, such as government’s recently announced 14-point plan, will help stimulate growth for business and other sectors of the economy.
1 Quarterly financial statistics (QFS), March 2017 (download here). In the QFS, the formal business sector includes private businesses and public corporations, but excludes agriculture, financial intermediation, insurance and government institutions.
2 Quarterly Labour Force Survey (QLFS), 1st Quarter 2017 (download here).
3 The South African economy shrinks by 0,7% (read here).
4 Mining: a brief history (read here).
5 Annual financial statistics (AFS) releases can be accessed here.
Similar thematic stories are available on Stats SA’s website and can be accessed here.