

Municipalities: Which are most in debt?
The answer might surprise you. Stats SA’s recently released Financial census of municipalities report, for 2016, provides in-depth detail on the financial state of South Africa’s municipalities, including levels of debt.
How solvent are South African municipalities? To answer that question, we turn to a financial ratio called the debt ratio. The debt ratio is calculated by dividing the total amount of municipal debt (or liabilities) by the total value of assets, and is expressed as decimal or percentage1.
Municipalities borrow money from various sources, including banks and public financial corporations. The money is either made available in the form of long-term loans and bonds (referred to as non-current liabilities) or short-term loans (current liabilities).
To put it simply, the debt ratio provides an indication as to how much municipalities rely on borrowed money to finance their assets.
Municipal debt – which includes both non-current and current liabilities – totalled R211 billion in 2016. With total assets worth R737 billion, that translates to a debt ratio of 29%. In other words, 29c of every rand used to finance municipal operations was in the form of debt.
Is 29% good or bad? National Treasury has stated that municipalities should not have a debt ratio higher than 45%2. So at the aggregate level, it seems that municipalities are in a healthy state in terms of their debt load.
The picture becomes more nuanced, however, if we break this down by municipality. In fact, the map below might be surprising to some. Municipalities with low debt levels (light orange) are located in predominantly rural provinces such as KwaZulu-Natal, Eastern Cape and Limpopo. Municipalities with high debt levels included those in Gauteng, Western Cape, and Free State (click on the map to enlarge).
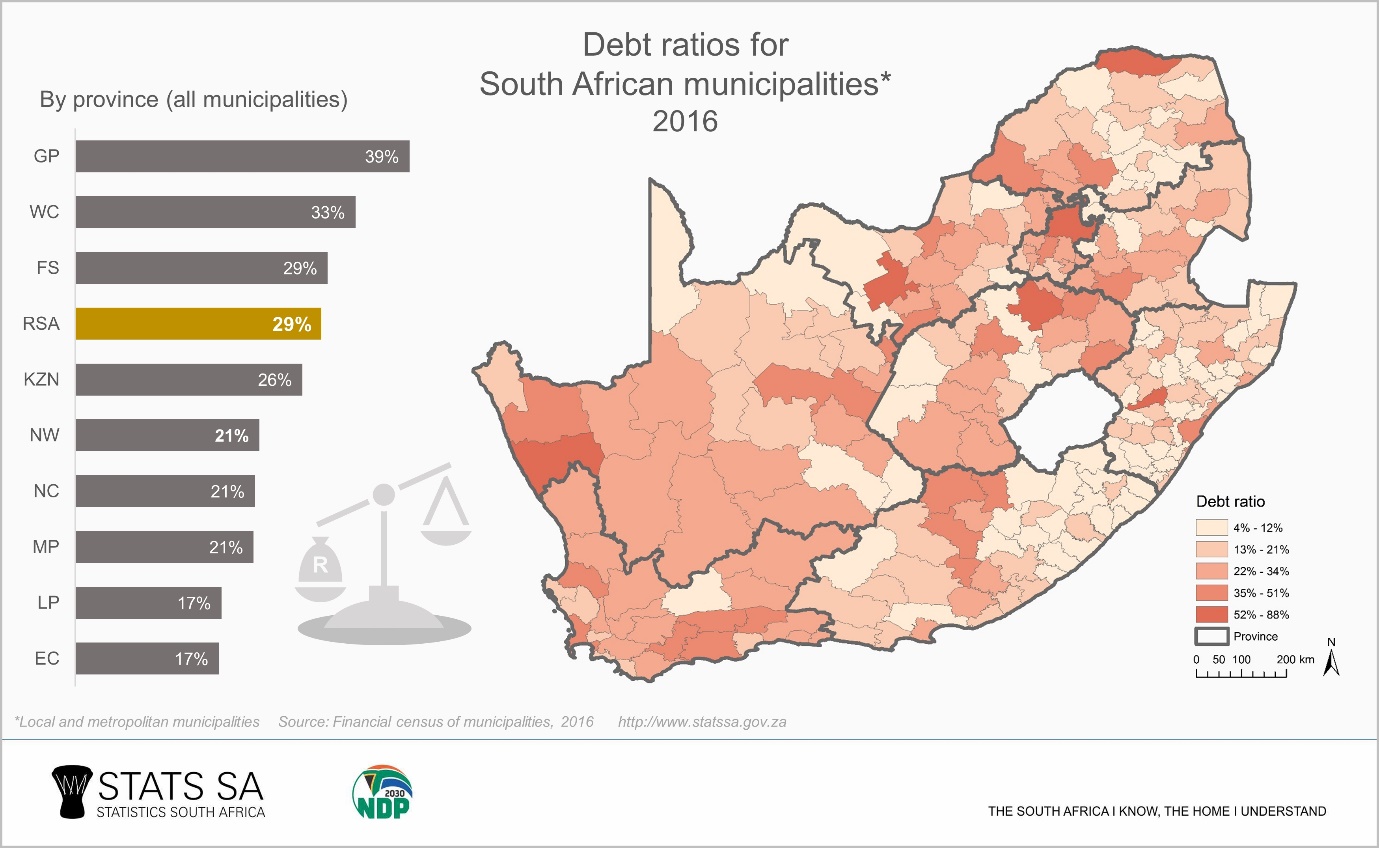
The three local municipalities with the highest debt ratio were Ngwathe in Free State (88%), Naledi in North West (65%) and Mpofana in KwaZulu-Natal (63%). Mhlontlo in Eastern Cape has the lowest at 4%. The metropolitan municipality with the highest debt ratio was Tshwane in Gauteng (56%).
Does this imply that municipalities in Eastern Cape and Limpopo are more careful with their finances? Not necessarily. Gauteng, for example, is the economic powerhouse of the country, consisting of three large metropolitan cities. Larger municipalities are perceived to be more stable financially and thus should carry a smaller risk of defaulting on loans. As a result, it should be relatively easier for them to borrow money.
Other factors to be kept in mind when interpreting the debt ratio include issues such as powers and functions that differ across different types of municipalities, the regulatory environment, accessibility to finances, and cash flows3.
Download the 2016 Financial census of municipalities report here.
Download the 2016 Financial census of municipalities media presentation here.
1 Using actual numbers may provide some perspective on the finances of the municipality. However, the use of accounting ratios enables users to delve deeper into the financial health of the municipality. Ratios do not necessarily mean much on their own, but they are very useful if used in the context of, for example, previous data and compared against industry (or sector) averages. There are numerous financial ratios, some which focus on solvency, others on liquidity, efficiency and profitability.
2 Municipal Finance Management Act (No. 56 of 2003), Circular No. 71 (click here)
3 For example, district municipalities are heavily reliant on grants mainly from national government to undertake their mandate, as well as having limited functions when compared to those of locals and metros.