
Which national government departments pay the highest average salaries?
South Africa’s 47 national government departments spent R137 billion on compensation of employees during the 2015/16 fiscal year. Which departments paid their employees the most in terms of compensation? Stats SA breaks it down for you.
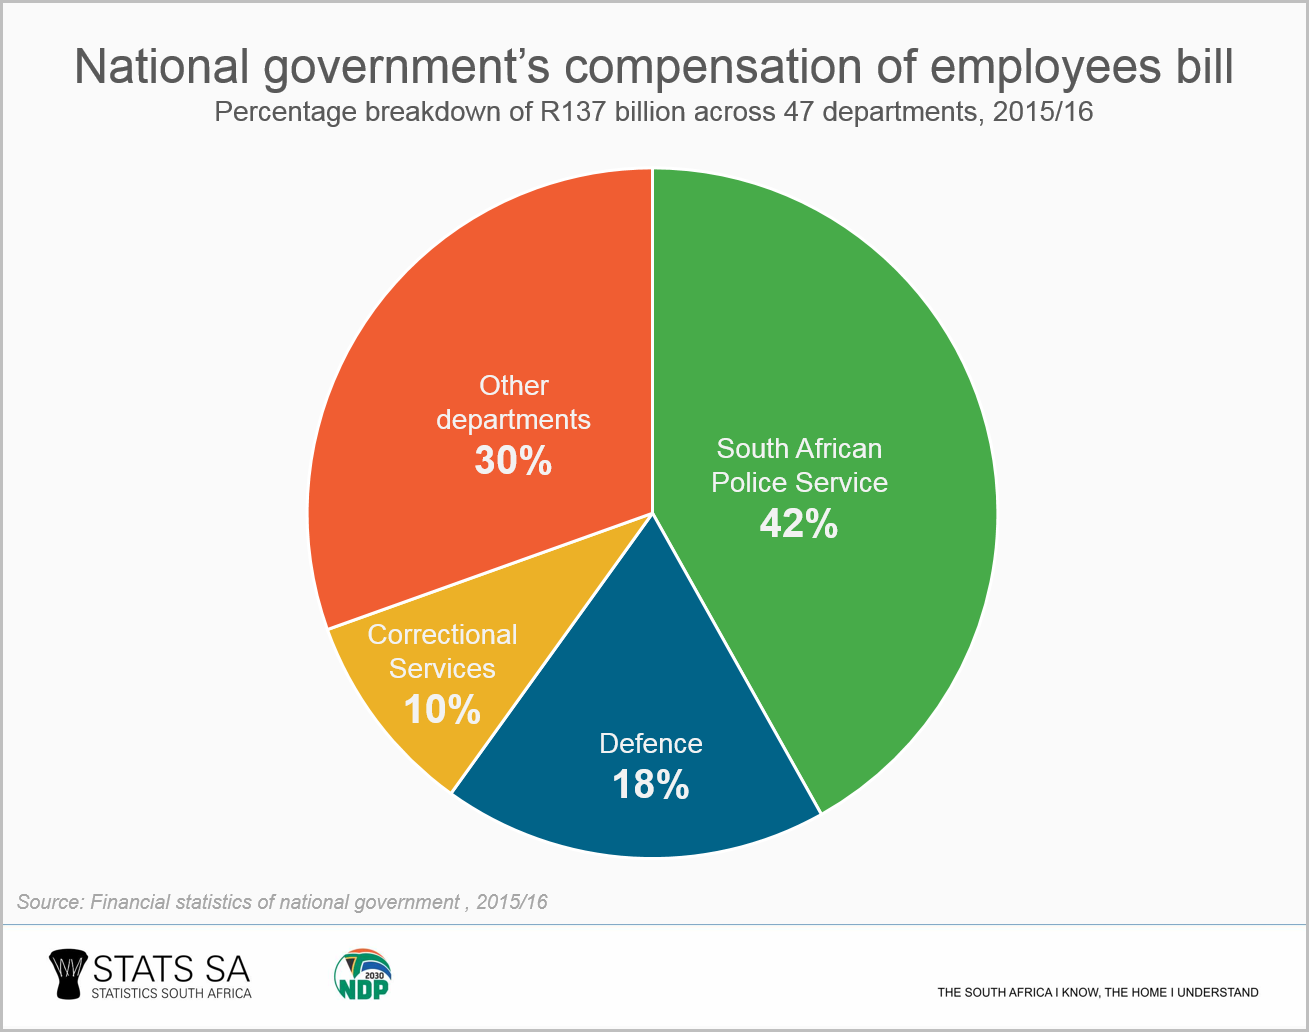
According to the data, sourced from the latest Financial statistics of national government report1, 70% of the R137 billion was taken up by three departments: South African Police Service (42%), Defence (18%) and Correctional Services (10%). All three share one common element: their main function revolves around security.
Another way in which to break down the data is to look at how much each department pays, on average, per civil servant2.
Ranked on this basis, the top spot is occupied by the Office of the Chief Justice, which spent R1,3 billion in compensation during 2015/16. With 1 613 employees under its wing, that translates to an annual compensation of R808 249 per person. That is not to suggest, however, that the Office of the Chief Justice is overly generous compared with other departments; rather, it points to a relatively high proportion of senior staff in the department, with the skills and experience to match.
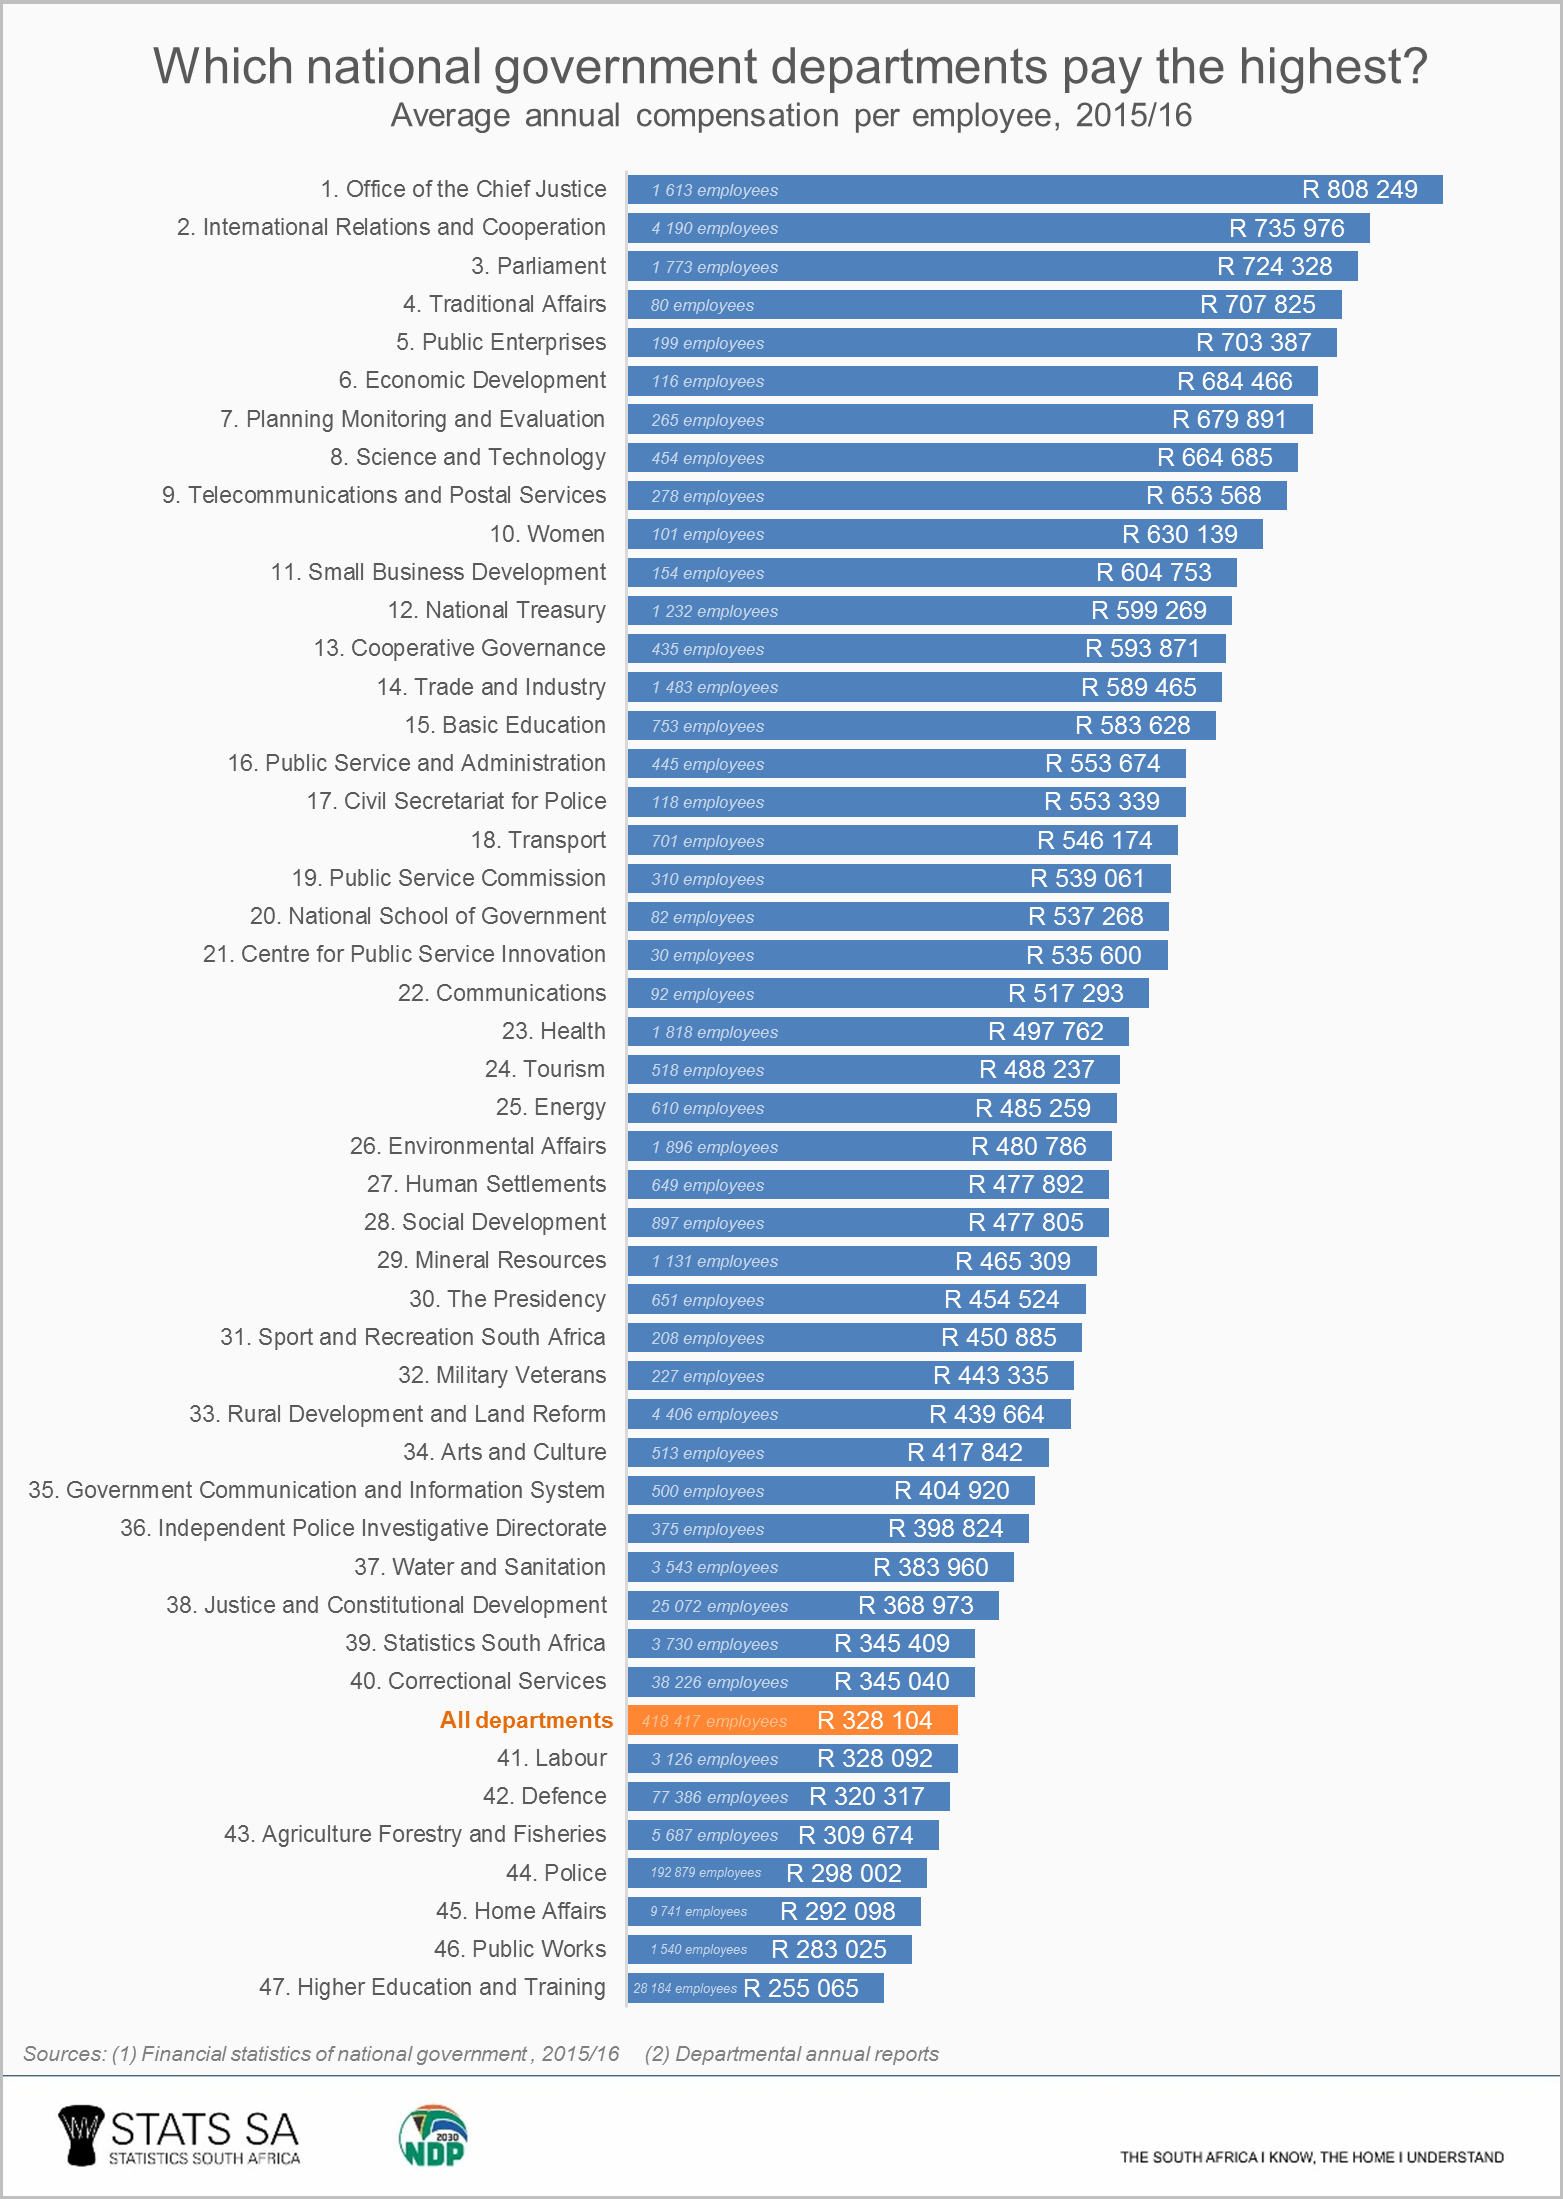
International Relations and Cooperation takes second spot (R735 976), followed by Parliament (R724 328) and Traditional Affairs (R707 825).
If we move down the list, we find National Treasury is ranked 12th (R599 269) and the Presidency 30th (R454 524). Stats SA is in 39th position (R345 409), appearing just below Justice and Constitutional Development and above Correctional Services.
Although the South African Police Service has the largest compensation bill, it is ranked 44th out of 47 departments in terms of average compensation. Employees earn an average of R298 002 per annum.
Of course, it is important to keep in mind that all the figures above are averages. They give no indication of how compensation spending is distributed across employees within a department. Skill levels, for example, vary significantly across the different departments.
The figures also provide no indication of other factors that might play a role. For example, Higher Education and Training, which has the lowest average salary in the graph above, at R255 065 per annum, had to take on the responsibility from provincial government to compensate staff at Technical and Vocational Education and Training (TVET) and Community Education and Training (CET) institutions in 2015/16.
For more information on national government finances, download the latest Financial statistics of national government report here.
1 The Financial statistics of national government report covers financial data from 47 government departments. It provides a measure of the impact of both the economic and functional effect of government spending, gauging the extent of the cost of certain functions (for example, health, environmental protection, defence) against their economic impacts (for example, purchases of goods and services and social benefits).
2 Employment figures for each department were sourced from departmental annual reports, available here. Note that these figures do not necessarily correspond with the figures that appear in Estimates of National Expenditure 2017 document published by National Treasury.
Similar thematic stories are available on Stats SA’s website and can be accessed here.