
28 000 jobs lost in SA formal sector third quarter of 2019
Formal sector employment decreased by 28 000 in September 2019, with 11 000 full-time and 17 000 part-time jobs shed during the quarter. The September 2019 Quarterly Employment Statistics (QES) survey showed that an estimated 10 142 000 people were employed in the formal non-agricultural sector of the South African economy, which is down by 28 000 from 10 170 000 in the read more »
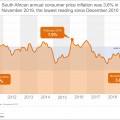
Inflation continues to edge lower
Annual inflation eased further in November, falling to 3,6% from October’s 3,7%. This is the third successive month of disinflation, which means that the pace of price increases is slowing down. November’s reading is the lowest since December 2010 when the rate was 3,5%. The highest rate recorded since December 2010 was 7,0% in February read more »
Stats Biz – November 2019
After rebounding by a revised 3,2% in the second quarter of 2019, activity in the South African economy slipped by 0,6% in the third quarter. Mining, manufacturing and transport were the biggest drags on growth in gross domestic product (GDP). Explore economic growth, as well as other stories, in this edition of Stats Biz. Download read more »

GDP contracts by 0,6% in the third quarter
After rebounding by a revised 3,2%1 in the second quarter of 2019, activity in the South African economy slipped slightly in the third quarter. Mining, manufacturing and transport were the biggest drags on growth in gross domestic product (GDP). Mining was down by 6,1%, driven largely by a fall in the production of platinum group read more »
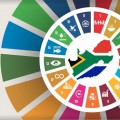
Tracking South Africa’s Sustainable Development Goals
Statistics South Africa (Stats SA) launched a new online data portal to enable tracking of the Sustainable Development Goals (SDGS) on 2 December 2019 at ISIbalo House in Pretoria. As the country’s supplier of official statistics, Stats SA is continuously working towards finding new and inventive ways of making data accessible to stakeholders, government and read more »
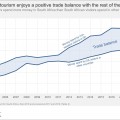
SA’s tourism trade balance edges lower
South Africa enjoys a positive tourism trade balance with the rest of the world. What this means is that non-resident visitors spend more money in our country than South African travellers spend abroad. However, the trade balance surplus has narrowed since 2016. In 2018, non-resident visitors1 (which includes both tourists and same-day visitors) spent a read more »
Statistics South Africa to release Gross domestic product (GDP) Q3, 2019
MEDIA ADVISORY 27 November 2019 Statistics South Africa read more »
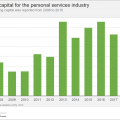
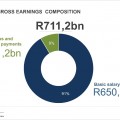
Working capital: how do South African businesses fare?
Stats SA provides a snapshot of working capital across the formal business sector in the latest release of the Annual Financial Statistics (AFS) report. Working capital is a measure of a company’s liquidity and is one of a number of measures that provide insight into a company’s ability to pay off debt. To calculate working read more »
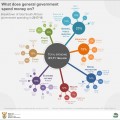
Government spending climbs to R1,71 trillion
The South African government spent 7,3% more in 2017/18 than it did in 2016/17. The rise was largely driven by general public services, education and health. This pushed total government spending up to R1,71 trillion1 in 2017/18, R116 billion more than the R1,59 trillion spent in 2016/17. This is according to the latest Financial statistics of consolidated general read more »
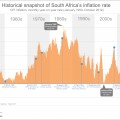
Inflation the lowest in over eight years
Annual consumer inflation continued its downward streak, dropping to 3,7% in October from 4,1% in September. October’s reading is the lowest since February 2011 when the annual rate was also 3,7%. Consumers can breathe a sigh of relief at this news, as the prices of many goods and services are increasing at a much slower read more »