

Municipalities experience a rise in employee-related costs
Employee-related costs of municipalities rose from R61,2 billion in 2012/13 to R68,4 billion in 2013/14, an rise of 11,6%. This is one of the findings from the latest Financial census of municipalities report published by Stats SA. Metropolitan municipalities contributed 57,3% (R39 billion) of total municipal employee related costs in 2013/14. Local municipalities contributed 34,6% read more »
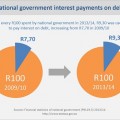
Debt, taxes and spending: national government finances in the spotlight
Approximately 9% (or R101 billion) of total national government expenditure for the 2013/14 financial year was on interest on state debt. This is one of the findings from Stats SA’s latest Financial statistics of national government report. Using financial data from 41 government departments, the report measures national government spending, broken down by function (e.g. read more »
The importance of coal
Calls to decrease the world’s dependence on coal as an energy source are well intentioned. Lower use would reduce greenhouse gas emissions, and less demand would lower the environmental risk of coal mining. However, as the world moves away from coal, South Africa will need to consider the implications. The country depends heavily on the read more »
DevTalk—Why, What and How: Jabs for a successful SDG experience
The great book says it all in Matthew 26-11 that “The poor you will always have with you but you will not always have me”. And in Matthew 19-24 the great book says ‘Again I tell you, it is easier for a camel to go through the eye of a needle than for someone who read more »
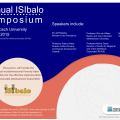
Annual ISIbalo symposium
Statistics South Africa is proud to announce that several high profile speakers have been lined up for the Annual ISIbalo symposium taking place at Stellenbosch University on 29 June 2015. They include Mr Jeff Radebe, Minister in the Presidency, Rector and Vice Chancellor of Stellenbosch university, Professor Wim de Villiers, Mr Pali Lehohla, Statistician General read more »
World Statistics Day 2015
On 3 June 2015, the United Nations General Assembly adopted a resolution officially designating 20 October 2015 as the second World Statistics Day, under the general theme “Better data. Better lives”. In addition, the General Assembly decided to celebrate World Statistics Day on 20 October every five years. This resolution, which was co-sponsored by Hungary read more »
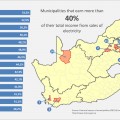
Electricity redistribution: Which councils are likely to feel the pinch?
In April 2015 the acting CEO of Eskom suggested that in order to improve Eskom’s financial situation, that the utility bypass municipalities and supply all customers directly with electricity. How would municipalities be affected if this proposal is adopted? Acting as middle-men, municipalities buy electricity from Eskom in bulk and then re-sell the power to read more »
Households report increased access to basic services as satisfaction with some services decline.
The percentage of households in South Africa without access to an improved source of sanitation has decreased consistently over the past decade. The latest General Household Survey (GHS) found that the percentage of households with access to improved sanitation, that is flush toilets or pit toilets with ventilation pipes, has increased consistently from 62,3% in read more »
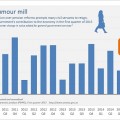
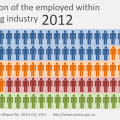
A rumour wobbles an industry
Misinformation and hearsay have the power to influence an economy. Thousands of civil servants resigned from their posts in 2014 and early 2015 in response to rumours about proposed pension reforms. The economic effect was large enough to be seen in recent gross domestic product (GDP) data released by Stats SA. The government services sector read more »
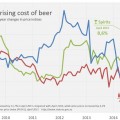
Drink and diesel: The Budget Speech and consumer inflation
If you drive a car or enjoy a regular glass of wine, February’s National Budget Speech would have had an impact on your cost of living. The rise in sin taxes and petrol levies announced during the speech influenced prices for alcoholic beverages and petrol, contributing to April’s overall inflation rate of 4,5%. The Minister read more »