
Tsantsabane
Quick Fact
2,59% Population growth rate (2001-2011).
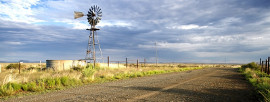
Tsantsabane Local Municipality is located within the north-eastern parts of the Northern Cape Province, and falls within the boundaries of the Siyanda District Municipality. Tsantsabane was the original name given to the town by the Batswana because of the presence of many shiny stones (e.g. the hematite).
The nearest business centre is Kimberley, which is about 200km away. The municipality’s main town is Postmasburg. Three main traffic routes provide access to other cities, namely Johannesburg via Kuruman and the Kalahari and Cape Town via Kimberley. The rest of the Tsantsabane Municipality area comprises of Boichoko, Postdene, New Town, Stasie, Groen Water, Skyfontein, Jean Heaven, the new established settlement brought about by the land redistribution called Marenane, and the well-known Lohatlha Army Battle SchoolCities/Towns: Beeshoek and Postmasburg. Area: 18,333km².
| Rank view all | ||
|---|---|---|
| Swellendam , Western Cape | 35,916 | 192 |
| Mookgopong , Limpopo | 35,640 | 193 |
| The Big 5 False Bay , KwaZulu-Natal | 35,258 | 194 |
| Tsantsabane , Northern Cape | 35,093 | 195 |
| Emadlangeni , KwaZulu-Natal | 34,442 | 196 |
| Mohokare , Free State | 34,146 | 197 |
| Gariep , Eastern Cape | 33,677 | 198 |
Quick Fact
13,7% of those 20+ have no schooling.
According to census 2011, there are 35 093 people in the municipality. Of these, 52,8% are African black, 37,6% are coloured, and 8,4% are white. Other population groups make up the remaining 1,2% of the population.
Of those aged 20 years and older, 13,9% had some primary schooling, 5,3% had completed primary, 35,4% had some secondary, and 25,4 had matric. Only 6,4% had a higher qualification, and 13,7% had no form of schooling.
| Group | Percentage |
|---|---|
| Black African | 52,8% |
| Coloured | 37,6% |
| Indian/Asian | 0,6% |
| White | 8,4% |
| Other | 0,6% |
| Age | Males | Females |
|---|---|---|
| 0-4 | 5,3% | 5,3% |
| 5-9 | 4,3% | 4,4% |
| 10-14 | 4,6% | 4,2% |
| 15-19 | 4,4% | 4,2% |
| 20-24 | 5,9% | 4,8% |
| 25-29 | 6,1% | 4,6% |
| 30-34 | 5,2% | 3,7% |
| 35-39 | 3,8% | 3,4% |
| 40-44 | 3,1% | 2,8% |
| 45-49 | 2,6% | 2,6% |
| 50-54 | 2,2% | 2,3% |
| 55-59 | 1,7% | 1,6% |
| 60-64 | 1,3% | 1,4% |
| 65-69 | 0,7% | 1% |
| 70-74 | 0,5% | 0,7% |
| 75-79 | 0,3% | 0,5% |
| 80-84 | 0,1% | 0,2% |
| 85+ | 0,1% | 0,3% |
| Language | Percentage |
|---|---|
| Afrikaans | 54,5% |
| English | 2,3% |
| IsiNdebele | 0,7% |
| IsiXhosa | 2,4% |
| IsiZulu | 1,1% |
| Sepedi | 0,4% |
| Sesotho | 2,3% |
| Setswana | 32,8% |
| Sign Language | 0,5% |
| SiSwati | 0,1% |
| Tshivenda | 0,3% |
| Xitsonga | 0,2% |
| Other | 1.3% |
| Not Applicable | 1,3% |
| Group | Percentage |
|---|---|
| Married | 22,9% |
| Living together like married partners | 9,5% |
| Never married | 62,8% |
| Widower/Widow | 3,3% |
| Separated | 0,6% |
| Divorced | 0,9% |
| Group | Percentage |
|---|---|
| No Schooling | 4,6% |
| Some Primary | 41% |
| Completed Primary | 6,4% |
| Some Secondary | 32,1% |
| Completed Secondary | 13,7% |
| Higher Education | 1% |
| Not Applicable | 1,2% |
| Sex | Percentage |
|---|---|
| Female | 47,7% |
| Male | 52,3% |
Quick Fact
83,5% Use electricity for lighting.

There are 9 839 households in the municipality and the population has access to the following basic services:
- 96,0% of the households have access to water.
- 68,9% of the population has access to flush toilet.
- 83,5% has access to internet facilities.
- 58,6% has access to refuse removal.
| Area | Percentage |
|---|---|
| Urban | 90,3% |
| Tribal/Traditional | 0% |
| Farm | 9,7% |
| Item | Yes | No |
|---|---|---|
| Cellphone | 86,1% | 13,9% |
| Computer | 18,8% | 81,2% |
| Television | 71% | 29% |
| Satellite Television | 32% | 68% |
| Radio | 56,4% | 43,6% |
| Landline / Telephone | 8,2% | 91,8% |
| Motor Car | 30,9% | 69,1% |
| Refrigerator | 67,1% | 32,9% |
| Electric / Gas-Stove | 82,7% | 17,3% |
| Energy Source | Cooking | Heating | Lighting |
|---|---|---|---|
| Electricity | 79,1% | 69,1% | 83,5% |
| Gas | 8,7% | 3,4% | 0,4% |
| Paraffin | 3,8% | 1,4% | 0,7% |
| Solar | 0,3% | 0,4% | 1,3% |
| Candles | 0% | 0% | 13,8% |
| Wood | 7,1% | 16,6% | 0% |
| Coal | 0,1% | 0,3% | 0% |
| Animal Dung | 0% | 0,1% | 0% |
| Other | 0,1% | 0% | 0% |
| None | 0,9% | 8,6% | 0,5% |
| Access | Percentage |
|---|---|
| From Home | 6,2% |
| From Cellphone | 16,1% |
| From Work | 3,2% |
| From Elsewhere | 2,4% |
| No Access | 72,2% |
| Tenure Status | Percentage |
|---|---|
| Rented | 24,3% |
| Owned and fully paid off | 40,4% |
| Owned but not yet paid off | 4,3% |
| Occupied rent free | 26,4% |
| Other | 4,5% |
| Source of water | Percentage |
|---|---|
| Regional/Local water scheme (operated by municipality or other water services provider) | 76,7% |
| Borehole | 11,7% |
| Spring | 0,1% |
| Rain water tank | 0,1% |
| Dam/Pool/Stagnant water | 5,1% |
| River/Stream | 0,1% |
| Water vendor | 0,2% |
| Water tanker | 1,5% |
| Other | 4,4% |
| Toilet Facility | Percentage |
|---|---|
| None | 18,3% |
| Flush toilet (connected to sewerage system) | 66,7% |
| Flush toilet (with septic tank) | 2,2% |
| Chemical toilet | 1,2% |
| Pit toilet with ventilation | 2,6% |
| Pit toilet without ventilation | 2% |
| Bucket toilet | 5,6% |
| Other | 1,4% |
| Refuse Disposal | Percentage |
|---|---|
| Removed by local authority/private company at least once a week | 57,4% |
| Removed by local authority/private company less often | 1,3% |
| Communal refuse dump | 6,4% |
| Own refuse dump | 25,4% |
| No rubbish disposal | 8,3% |
| Other | 1,3% |
| Refuse Disposal | Percentage |
|---|---|
| Removed by local authority/private company at least once a week | 57,4% |
| Removed by local authority/private company less often | 1,3% |
| Communal refuse dump | 6,4% |
| Own refuse dump | 25,4% |
| No rubbish disposal | 8,3% |
| Other | 1,3% |
Quick Fact
32,3% Youth unemployment rate.
Economically Tsantsabane is known for being rich in minerals, and for its mining, agriculture, manufacturing and farming sectors. Tsantsabane has reinvented itself over the years as one of the leading investment hot spots in the Northern Cape. The construction of the Anglo American Kumba Iron Ore’s Kolomela mine has brought an implosion of development to the area.
Kolomela mine is one of Anglo American’s Big Four expansion projects alongside Barro Alto in Brazil (nickel), Minas Rio in Brazil (ferrous) and Los Bronces in Chile (copper). The mine is situated in the town of Postmasburg in the Northern Cape Province, South Africa. The name Kolomela means “to dig deeper or further”, or “to persevere”, and the excellent physical strength of Kolomela mine’s lump ore will enable Kumba tocontinue to meet its customers’ needs.
- Kolomela is scheduled to produce 9Mtpa of direct shipping ore once it is fully operational in 2013.
- Its total mineral resource is 373Mt at 64% Fe cut-off grade and 405Mt at 55% Fe cut-off grade..
- Total investment in social and community projects in 2011 over R30,9 million.
- R8,5 billion investment in the Northern Cape.
| Employment Status | Number |
|---|---|
| Employed | 10760 |
| Unemployed | 3795 |
| Discouraged Work Seeker | 419 |
| Not Economically Active | 8764 |
| Income | Percentage |
|---|---|
| None income | 12,9% |
| R1 - R4,800 | 2,7% |
| R4,801 - R9,600 | 4,2% |
| R9,601 - R19,600 | 14,1% |
| R19,601 - R38,200 | 18,5% |
| R38,201 - R76,4000 | 16,5% |
| R76,401 - R153,800 | 14,2% |
| R153,801 - R307,600 | 9,6% |
| R307,601 - R614,400 | 5,1% |
| R614,001 - R1,228,800 | 1,4% |
| R1,228,801 - R2,457,600 | 0,5% |
| R2,457,601+ | 0,3% |
| Agricultural households | |
|---|---|
| Type of specific activity | Number |
| Livestock production | 671 |
| Poultry production | 533 |
| Vegetable production | 115 |
| Production of other crops | 101 |
| Other | 142 |
**An agricultural household may engage in more than one agricultural activity
| Agricultural households | |
|---|---|
| Type of activity | Number |
| Crops only | 99 |
| Animals only | 858 |
| Mixed farming | 117 |
| Other | 58 |
**An agricultural household may not fall under more than one agricultural activity
| Income category of agricultural households | |
|---|---|
| Annual income category of agricultural household heads | Number |
| No income | 212 |
| R1-R4 800 | 43 |
| R4 801-R38 400 | 481 |
| R38 401-R307 200 | 294 |
| R307 201+ | 70 |
| Unspecified | 33 |
| Agricultural households municipal data per province |
|---|
| Western Cape (download) |
| Eastern Cape (download) |
| Northern Cape (download) |
| Free State (download) |
| KwaZulu-Natal (download) |
| North West (download) |
| Gauteng (download) |
| Mpumalanga (download) |
| Limpopo (download) |
**Please note that each province contains twenty five tables
Place names
Key Statistics 2011
| Total population | 35,093 |
| Young (0-14) | 27,9% |
| Working Age (15-64) | 67,6% |
| Elderly (65+) | 4,4% |
| Dependency ratio | 47,8 |
| Sex ratio | 109,8 |
| Growth rate | 2,59% (2001-2011) |
| Population density | 2 persons/km2 |
| Unemployment rate | 26,1% |
| Youth unemployment rate | 32,3% |
| No schooling aged 20+ | 13,7% |
| Higher education aged 20+ | 6,3% |
| Matric aged 20+ | 25,3% |
| Number of households | 9,839 |
| Number of Agricultural households | 1,132 |
| Average household size | 3,5 |
| Female headed households | 31,3% |
| Formal dwellings | 71,8% |
| Housing owned/paying off | 44,7% |
| Flush toilet connected to sewerage | 66,7% |
| Weekly refuse removal | 57,4% |
| Piped water inside dwelling | 45,3% |
| Electricity for lighting | 83,5% |
Key Statistics 2001
| Total population | 27,082 |
| Young (0-14) | 31,4% |
| Working Age (15-64) | 67,6% |
| Elderly (65+) | 4,7% |
| Dependency ratio | 56,4% |
| Sex ratio | 96,1 |
| Growth rate | 0,38% (2001-2011) |
| Unemployment rate | 33,9% |
| Youth unemployment rate | 43,1% |
| No schooling aged 20+ | 24,2% |
| Higher education aged 20+ | 4,1% |
| Matric aged 20+ | 16,7% |
| Number of households | 6,800 |
| Average household size | 3,9 |
| Female headed households | 33,1% |
| Formal dwellings | 81,4% |
| Housing owned/paying off | 53,9% |
| Flush toilet connected to sewerage | 61,7% |
| Weekly refuse removal | 67,5% |
| Piped water inside dwelling | 35,5% |
| Electricity for lighting | 74,4% |