
Hlabisa
Quick Fact
Just 3% of the population reside in the town of Hlabisa
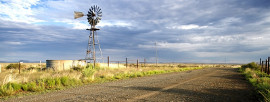
Hlabisa Municipality is one of the local Municipalities under Umkhanyakude district in the KwaZulu-Natal province. The municipality was named after the surname, Hlabisa, of two Nkosi’s in the area. The municipality is generally characterised by rural communities predominantly under traditional areas. 91% of land was under traditional authority, 3% commercial farmland and 6% urban. The major town is Hlabisa, with secondary nodes of Mpembeni, Zibayeni and Ezibayeni.
| Rank view all | ||
|---|---|---|
| Victor Khanye , Mpumalanga | 75,452 | 139 |
| Ntambanana , KwaZulu-Natal | 74,336 | 140 |
| Ngqushwa , Eastern Cape | 72,190 | 141 |
| Hlabisa , KwaZulu-Natal | 71,925 | 142 |
| Knysna , Western Cape | 68,659 | 143 |
| Modimolle , Limpopo | 68,513 | 144 |
| Musina , Limpopo | 68,359 | 145 |
Quick Fact
Hlabisa had the highest proportion of under 15-year olds in the province – 41,4%
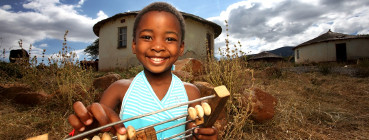
The municipality population totaled 71 925 people in 2001 and was inhabited by Black Africans who made up 100% of the total population. 94% spoke IsiZulu as a home language. The under 20 age group constitued a significant amount of the population, just over half the population (54%) were of working age with only 4% of the population 65 years and older. The proportion of women stood at 54% while males made up 46% of the total population. This profile is indicative of the mostly male, and working-age migration patterns.
Education
The level of education for the community of Hlabisa is relatively low – 22% had no schooling, 26% had completed matric and just 1,7% had higher education. Although there were high levels of school attendance, very few people progress to tertiary institution or achieve post matric qualification. School attendance is high however, of those aged between 5 and 24 years, 82% people were attending school, primary school enrollment stood at 92%.
Health
Statistics provided by the Department of Health shows that facility mortality rate for children under one year was 9,9% and that of children under five years was 7,5%.
Births
The high proportion of persons aged under 4 years – 15% of the population – was indicative of higher birth rates and survival rates associated improved health services and access to anti-retroviral medication. Hlabisa had the highest proportion of young persons in the province.
Deaths
While the higher proportion of 0-4 years was indicative of a reduction in infant mortality, mortality rates are still high. The number of HIV deaths accounted for7% of deaths in 2010. Tuberculosis accounted for the highest number of deaths – 21%, followed by Intestinal infectious diseases (9%) and cerebrovascular diseases (5%). A total of 1 179 deaths were recorded, with 4,6% due to non-natural causes.
| Group | Percentage |
|---|---|
| Black African | 99,4% |
| Coloured | 0,1% |
| Indian/Asian | 0,2% |
| White | 0,1% |
| Other | 0,2% |
| Age | Males | Females |
|---|---|---|
| 0-4 | 7,5% | 7,5% |
| 5-9 | 6,6% | 6,4% |
| 10-14 | 6,7% | 6,6% |
| 15-19 | 7% | 6,7% |
| 20-24 | 4,4% | 5,4% |
| 25-29 | 3% | 4,1% |
| 30-34 | 1,9% | 2,7% |
| 35-39 | 1,6% | 2,3% |
| 40-44 | 1,3% | 2,1% |
| 45-49 | 1,2% | 1,2% |
| 50-54 | 1,2% | 1,9% |
| 55-59 | 1,1% | 1,6% |
| 60-64 | 0,9% | 1,3% |
| 65-69 | 0,6% | 0,9% |
| 70-74 | 0,4% | 0,9% |
| 75-79 | 0,2% | 0,6% |
| 80-84 | 0,2% | 0,5% |
| 85+ | 0,2% | 0,4% |
| Language | Percentage |
|---|---|
| Afrikaans | 0,3% |
| English | 1,2% |
| IsiNdebele | 1,5% |
| IsiXhosa | 0,1% |
| IsiZulu | 94,4% |
| Sepedi | 0,2% |
| Sesotho | 0,1% |
| Setswana | 0,7% |
| Sign Language | 0,7% |
| SiSwati | 0% |
| Tshivenda | 0% |
| Xitsonga | 0% |
| Other | 0.1% |
| Not Applicable | 0,6% |
| Group | Percentage |
|---|---|
| Married | 13,9% |
| Living together like married partners | 3,1% |
| Never married | 80,2% |
| Widower/Widow | 2,4% |
| Separated | 0,4% |
| Divorced | 0,1% |
| Group | Percentage |
|---|---|
| No Schooling | 3,1% |
| Some Primary | 46,3% |
| Completed Primary | 6,5% |
| Some Secondary | 31,7% |
| Completed Secondary | 11,4% |
| Higher Education | 0,4% |
| Not Applicable | 0,6% |
| Sex | Percentage |
|---|---|
| Female | 54,2% |
| Male | 45,8% |
Quick Fact
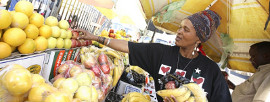
More then half of households had no access to piped water (via standpipe or in yard).

Hlabsisa Municipality had a total of 12 586 households in 2011 with average household size of 5,4 – the second highest in the province. The relatively large size of households is typical of the traditional, rural characteristic of the area. The proportion of households living in formal dwellings was was 68%. The municipality faces many challenges in the provision of infrastructure. The proportion of households with flush toilet connected to sewage was 7% and just 12,5% households had piped water inside dwelling and 55,4% households had access to electricity. This represents a significant increase in access to electricty, in 2001 less then a third of households had access to electricity.
Poverty
Hlabisa Municipality had high levels of poverty, with the third highest unemployment rate in the province – 53%. This means that over half the population of working age and available for work was unemployed. Almost 60% of households were headed by females, reflective of the mostly male migration patterns. The average household income income was 47 263 in 2011 up from 15 566 in 2001.
| Area | Percentage |
|---|---|
| Urban | 3,4% |
| Tribal/Traditional | 95,2% |
| Farm | 1,4% |
| Item | Yes | No |
|---|---|---|
| Cellphone | 88,6% | 11,4% |
| Computer | 3,5% | 96,5% |
| Television | 45,5% | 54,5% |
| Satellite Television | 7,2% | 92,8% |
| Radio | 68,8% | 31,2% |
| Landline / Telephone | 3,2% | 96,8% |
| Motor Car | 12,7% | 87,3% |
| Refrigerator | 48,2% | 51,8% |
| Electric / Gas-Stove | 50% | 50% |
| Energy Source | Cooking | Heating | Lighting |
|---|---|---|---|
| Electricity | 37,3% | 28,4% | 55,4% |
| Gas | 9,1% | 2,4% | 0,5% |
| Paraffin | 2,9% | 1% | 0,6% |
| Solar | 0,3% | 0,4% | 3,8% |
| Candles | 0% | 0% | 38,6% |
| Wood | 49,3% | 47,1% | 0% |
| Coal | 0,4% | 2,8% | 0% |
| Animal Dung | 0,1% | 0,1% | 0% |
| Other | 0,3% | 0% | 0% |
| None | 0,3% | 17,8% | 1,1% |
| Access | Percentage |
|---|---|
| From Home | 1,4% |
| From Cellphone | 22,4% |
| From Work | 2% |
| From Elsewhere | 2,8% |
| No Access | 71,4% |
| Tenure Status | Percentage |
|---|---|
| Rented | 7,7% |
| Owned and fully paid off | 26,7% |
| Owned but not yet paid off | 13,8% |
| Occupied rent free | 45% |
| Other | 6,8% |
| Source of water | Percentage |
|---|---|
| Regional/Local water scheme (operated by municipality or other water services provider) | 23% |
| Borehole | 11,5% |
| Spring | 6,7% |
| Rain water tank | 2,1% |
| Dam/Pool/Stagnant water | 8,3% |
| River/Stream | 39,2% |
| Water vendor | 1,2% |
| Water tanker | 3,3% |
| Other | 4,8% |
| Toilet Facility | Percentage |
|---|---|
| None | 7,1% |
| Flush toilet (connected to sewerage system) | 4,1% |
| Flush toilet (with septic tank) | 3,3% |
| Chemical toilet | 27,3% |
| Pit toilet with ventilation | 40,7% |
| Pit toilet without ventilation | 14% |
| Bucket toilet | 1,8% |
| Other | 1,6% |
| Refuse Disposal | Percentage |
|---|---|
| Removed by local authority/private company at least once a week | 5,4% |
| Removed by local authority/private company less often | 2,2% |
| Communal refuse dump | 1,2% |
| Own refuse dump | 72,4% |
| No rubbish disposal | 17,7% |
| Other | 1,1% |
| Refuse Disposal | Percentage |
|---|---|
| Removed by local authority/private company at least once a week | 5,4% |
| Removed by local authority/private company less often | 2,2% |
| Communal refuse dump | 1,2% |
| Own refuse dump | 72,4% |
| No rubbish disposal | 17,7% |
| Other | 1,1% |
Quick Fact
Hlabisa had the 4th highest youth unemployment rate in the province 62%
The major economic activity is tourism which is centred in adjacent Hlulhuwe-Umfolozi game reserve. Hlabisa had limited economic development opportunities and in 2011, with over half the population of working age, available for work. There were few primary investment points in the municipality, and the most significant economic activity was household-based agriculture, mainly subsistence in nature.
| Employment Status | Number |
|---|---|
| Employed | 5396 |
| Unemployed | 5983 |
| Discouraged Work Seeker | 4722 |
| Not Economically Active | 22609 |
| Income | Percentage |
|---|---|
| None income | 12,3% |
| R1 - R4,800 | 5,2% |
| R4,801 - R9,600 | 10,9% |
| R9,601 - R19,600 | 23,2% |
| R19,601 - R38,200 | 24,7% |
| R38,201 - R76,4000 | 12,9% |
| R76,401 - R153,800 | 6% |
| R153,801 - R307,600 | 3,1% |
| R307,601 - R614,400 | 1,4% |
| R614,001 - R1,228,800 | 0,2% |
| R1,228,801 - R2,457,600 | 0,1% |
| R2,457,601+ | 0,1% |
| Agricultural households | |
|---|---|
| Type of specific activity | Number |
| Livestock production | 4,178 |
| Poultry production | 4,451 |
| Vegetable production | 3,013 |
| Production of other crops | 886 |
| Other | 382 |
**An agricultural household may engage in more than one agricultural activity
| Agricultural households | |
|---|---|
| Type of activity | Number |
| Crops only | 1,121 |
| Animals only | 3,836 |
| Mixed farming | 2,240 |
| Other | 57 |
**An agricultural household may not fall under more than one agricultural activity
| Income category of agricultural households | |
|---|---|
| Annual income category of agricultural household heads | Number |
| No income | 2,371 |
| R1-R4 800 | 337 |
| R4 801-R38 400 | 3,902 |
| R38 401-R307 200 | 370 |
| R307 201+ | 39 |
| Unspecified | 235 |
| Agricultural households municipal data per province |
|---|
| Western Cape (download) |
| Eastern Cape (download) |
| Northern Cape (download) |
| Free State (download) |
| KwaZulu-Natal (download) |
| North West (download) |
| Gauteng (download) |
| Mpumalanga (download) |
| Limpopo (download) |
**Please note that each province contains twenty five tables
Place names
Key Statistics 2011
| Total population | 71,925 |
| Young (0-14) | 41,4% |
| Working Age (15-64) | 53,8% |
| Elderly (65+) | 4,8% |
| Dependency ratio | 85,8 |
| Sex ratio | 84,5 |
| Growth rate | 0,38% (2001-2011) |
| Population density | 46 persons/km2 |
| Unemployment rate | 52,6% |
| Youth unemployment rate | 61,9% |
| No schooling aged 20+ | 21,9% |
| Higher education aged 20+ | 3,2% |
| Matric aged 20+ | 26,6% |
| Number of households | 12,586 |
| Number of Agricultural households | 7,254 |
| Average household size | 5,4 |
| Female headed households | 58,9% |
| Formal dwellings | 65,7% |
| Housing owned/paying off | 40,5% |
| Flush toilet connected to sewerage | 4,1% |
| Weekly refuse removal | 5,4% |
| Piped water inside dwelling | 12,5% |
| Electricity for lighting | 55,4% |
Key Statistics 2001
| Total population | 69,269 |
| Young (0-14) | 45,4% |
| Working Age (15-64) | 53,8% |
| Elderly (65+) | 4,8% |
| Dependency ratio | 100,7% |
| Sex ratio | 81,2 |
| Growth rate | 0,97% (2001-2011) |
| Unemployment rate | 76,3% |
| Youth unemployment rate | 84,4% |
| No schooling aged 20+ | 43,4% |
| Higher education aged 20+ | 2,9% |
| Matric aged 20+ | 13,4% |
| Number of households | 10,611 |
| Average household size | 6,3 |
| Female headed households | 58,5% |
| Formal dwellings | 47,9% |
| Housing owned/paying off | 44,2% |
| Flush toilet connected to sewerage | 7,4% |
| Weekly refuse removal | 2,8% |
| Piped water inside dwelling | 2,2% |
| Electricity for lighting | 28,7% |